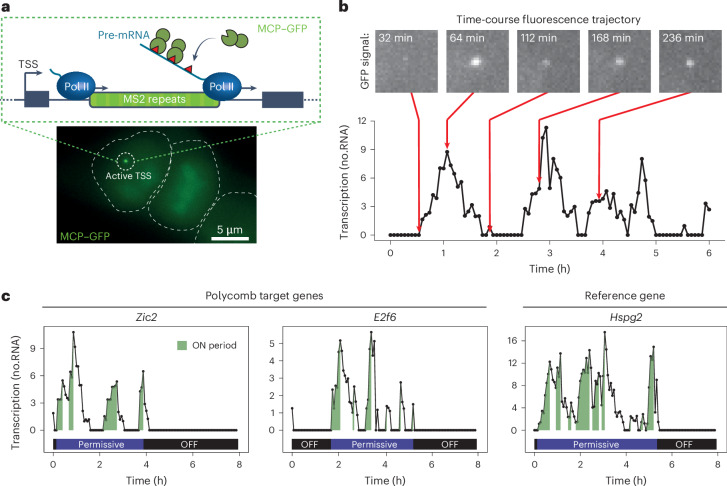
Fig. 1. Imaging Polycomb gene transcription in live cells.
a, Top: schematic illustrating the transcription imaging approach. MS2 repeats were inserted into a promoter-proximal intron of the genes of interest. As RNA Pol II passes through the array, nascent RNA presents MS2 stem loops that are bound by MCP–GFP leading to accumulation of fluorescence signal at the active transcription site. Bottom: an example image of a cell with a nascent transcription spot corresponding to the active TSS. The white dashed lines indicate the cell outline. b, Example of a transcription activity trajectory from cells engineered to contain the MS2/MCP–GFP system (Zic2). Maximal projections of the focalized MCP–GFP signal are shown above the trajectory to illustrate the pulsatile nature of transcription. c, Example transcription activity trajectories for Polycomb genes (Zic2 and E2f6) and a reference gene (Hspg2). ON (green), permissive (violet), and OFF periods (black) are illustrated. The y axis represents transcriptional activity (in RNA molecules). Source numerical data are available in Source data.

