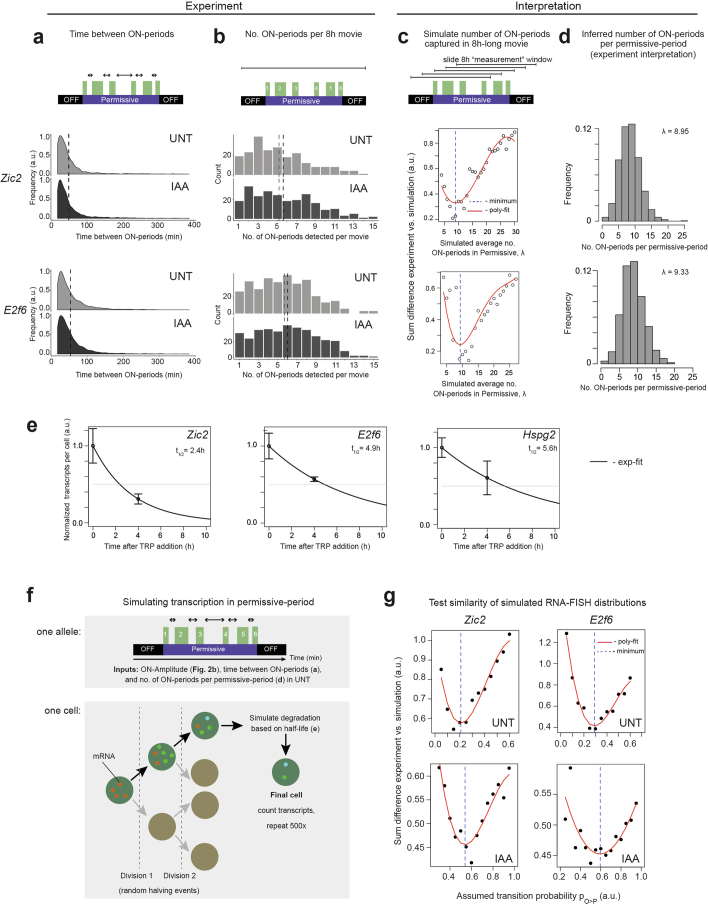
Extended Data Fig. 4. Stochastic simulations of transcription to obtain transcript-per-cell distributions and estimate transition probability from OFF- to Permissive-states for Polycomb genes.
(a) Density plots of time intervals between ON-periods (indicated as arrows in the cartoon) directly measured from live-cell transcription imaging trajectories for both Polycomb genes Zic2 (top) and E2f6 (bottom) for untreated (UNT) and PRC1-depleted (IAA) conditions. Dashed vertical lines represent mean values. ON-, permissive-, and OFF-periods are indicated in the cartoon in green, purple, and black, respectively. (b) Histograms of number of ON-periods detected per 8h live-cell transcription movie (indicated in the cartoon as blunt-end horizontal line). Dashed vertical lines represent mean values. (c) In order to interpret the detected number of ON-periods per 8h movie and infer the number of ON-periods in a permissive-period, the permissive-periods were simulated with varying mean Poisson-distributed number of ON-periods (λ, x-axis) and ‘sampled’ using a ‘sliding’ 8h window to represent the experimental measurement (blunt-end horizontal line in the cartoon). The sum difference between the resulting distribution and experimental distribution (presented in b) was calculated (y-axis). The red line represents 3rd-degree polynomial fit and its minimum (vertical dashed line) represented the mean number of ON-periods expected to produce most similar distribution of captured ON-periods per 8h measurement window. Plots for Zic2 (top) and E2f6 (bottom) are shown. (d) Histograms of inferred mean number of ON-periods per permissive-period for Zic2 (top) and E2f6 (bottom). (e) Estimates of transcript half-lives for Zic2, E2f6, and Hspg2. Data-points represent normalized mean number of transcripts in untreated (t=0) and after 4h of triptolide (TRP) treatment obtained by smRNA-FISH in three biological replicates. Solid black lines represent exponential fits. Horizontal grey lines represent half of the mean transcript number detected in untreated sample while error bars represent standard deviation. The intersection between black and grey lines indicates transcript half-life. (f) A cartoon illustrating the strategy to simulate transcription of Polycomb genes. (top) At an individual allele level every parameter of transcription necessary to simulate the permissive-state is quantified or inferred: ON-period amplitude (in transcripts), time between ON-periods, and number of ON-periods in a permissive state. (bottom) Cells were assumed to have on average 3 alleles, and were allowed two full cell cycles followed by cell divisions leading to random halving of the transcript numbers. Single cells were simulated leading to transcript accumulation. Once produced, transcripts were attributed a date-of-birth which was used at the end of the simulation to degrade transcripts based on mRNA half-life. This procedure was repeated 500 times to produce simulated single-cell distribution of transcripts-per-cell. (g) The procedure described in (f) was repeated using a range of probabilities of transitioning between OFF- and permissive- states (pO>P) to produce simulated transcript-per-cell distributions that were then compared to smRNA-FISH experimental data and the most similar were identified by the minimum in 3rd degree polynomial fit (red line) indicated as vertical blue line for Zic2 (left) and E2f6 (right) in untreated (UNT) or PRC1-depleted (IAA) conditions. Source numerical data are available in source data.

