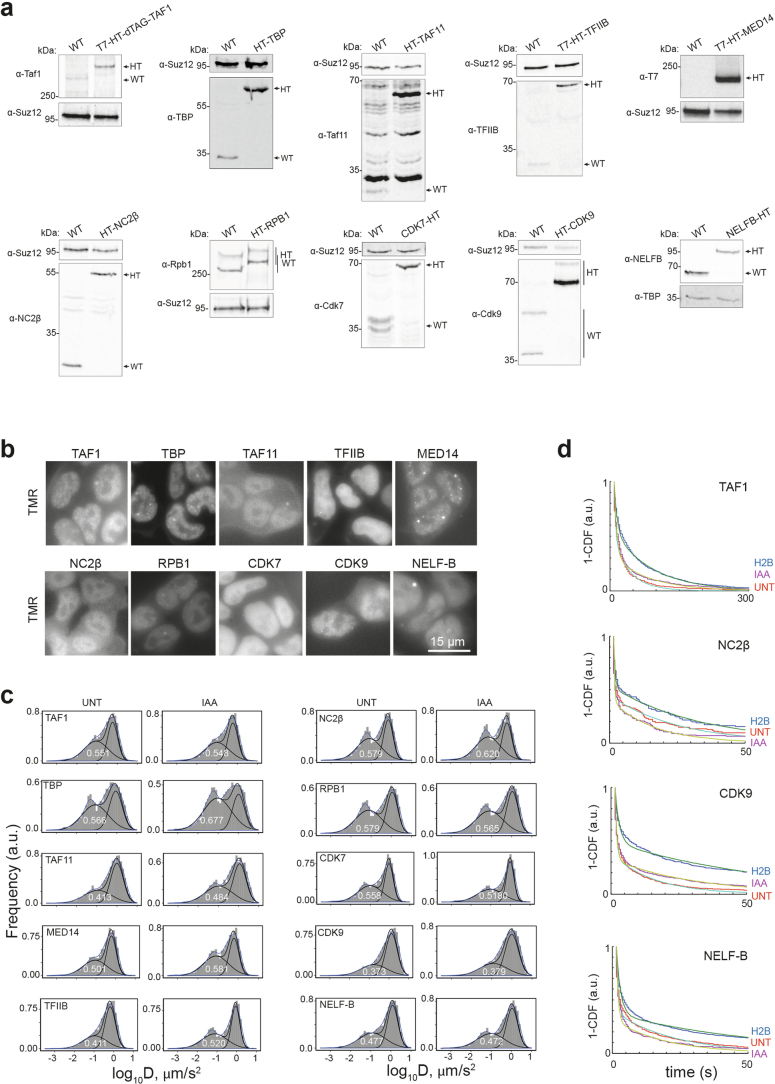
Extended Data Fig. 5. Extended data to single-particle tracking of transcription regulators.
(a) Western blot analysis of endogenously HALO-tagged factors comparing the signals in wild type and tagged lines. Antibodies and molecular weight markers (in kilodaltons (kDa)) are indicated on the left, wild type (WT) and HALO-Tag (HT) protein bands are indicated on the right with arrows. Micrographs are representative results repeated one to three times each. (b) Microscopy validation of the HALO-Tag expression in lines with endogenously tagged proteins. HALO-Tag-proteins were visualized using TMR-HALO ligand. All proteins localized to the nucleus. Representatives of at least 3 fields of view. Scale bar represents 15 µm and applies to all the images in the panel. (c) Examples of representative biological replicates of histograms of log10(D) calculated from single-particle tracking data acquired at high camera frame rate, obtained for the panel of transcription regulators with (UNT) and without PRC1 (IAA). Black solid lines represent a mixed two-Gaussian fit (to account for immobile and mobile fractions) with indicated value representing immobile portion of molecules. Blue solid line represents histogram density. (d) Examples of 1-CDF plots representing single molecule binding times acquired at low camera frame rate. Average stable binding time is extracted from bi-exponential fits indicated in the plots. Examples of data acquired with (UNT, red line) and without PRC1 (IAA, purple line) together with respective H2B-HT (blue). The latter represents a stable binding control used to correct photobleaching.

