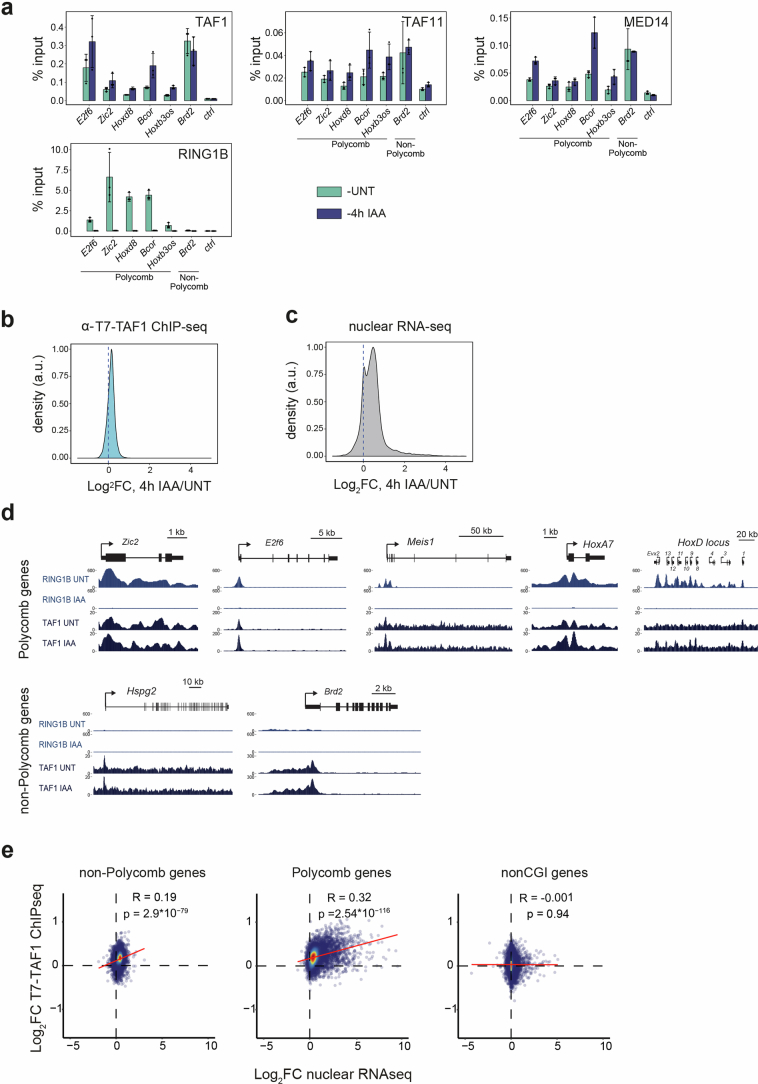
Extended Data Fig. 7. Effects of PRC1 on the binding of the components of transcription machinery.
(a) ChIP-qPCR analysis of TAF1, TAF11, and MED14 chromatin occupancy at promoters of E2f6, Zic2, HoxD8, Bcor, Hoxb3os (Polycomb genes), as well as Brd2 (non-Polycomb genes) prior (UNT, blue) and after PRC1 depletion (IAA, orange). Ctrl represents ChIP signal at a gene desert region. RINGB ChIP-qPCR at the target sites demonstrates complete depletion after 4h IAA treatment. Error bars represent standard deviation from n = 3 biological replicates around average values. (b) Density plot representing Log2 fold change (4h IAA/UNT) in T7-TAF1 ChIP signal for all the genes (n = 20,633) within the TSSs (+/− 1kb). (c) Density plot representing Log2 fold change (4h IAA/UNT) in cnRNA-seq signal for all the genes (n = 20,633). Data from Dobrinic et al.21. (d) Genomic snapshots for Zic2, E2f6, Meis1, HoxA7, HoxD locus (Polycomb genes), as well as Hspg2 and Brd2 (non-Polycomb genes) shown RING1B and T7-TAF1 before and after 4h of RING1B depletion (IAA). (e) Correlation between changes in expression (Log2 fold change in cnRNA-seq) and changes in T7-TAF1 binding for non-Polycomb genes, Polycomb genes, and genes with no CpG islands (nonCGI genes). R represents two-sided Pearson correlation with exact p-values presented. Source numerical data are available in source data.

