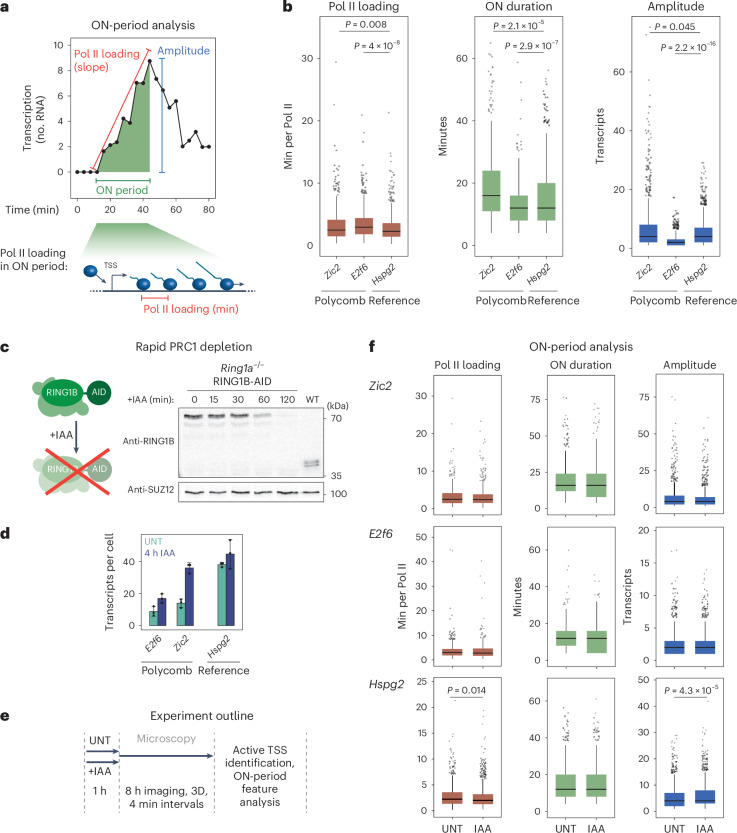
Fig. 2. PRC1 does not constrain transcription during ON periods.
a, Schematic illustrating the ON-period features extracted from transcription imaging trajectories. These include the rate of RNA Pol II initiation within the ON period (from linear fit of the slope), the duration of the ON period (min) and the amplitude of the ON period (transcripts). b, Box plots centred on the median value comparing the ON-period features, with the interquartile range (IQR) demarcating the minimal and maximal values, whiskers as 1.5× IQR and outliers as dots. Individual data points correspond to individual ON periods (at least 573 measured per box plot). P values were estimated using a two-sided Kolmogorov–Smirnov. Box plots represent data from four (Zic2), three (E2f6) and two (Hspg2) biological replicates. c, Left: diagram illustrating the auxin-inducible system used to rapidly deplete the catalytic subunit of PRC1 (RING1B) in a Ring1a−/− background. Right: western blot analysis of RING1B-AID levels over a 2-h period after addition of auxin (IAA) (right) compared with a wild-type (WT) mouse ES cell line. Shown is a representative example of three independent experiments. d, smRNA-FISH analyses of E2f6, Zic2 and Hspg2 expression 4 h after PRC1 depletion. Dots represent individual biological replicates (n = 3, with >400 cells per replicate) and error bars represent the s.d. e, Schematic illustrating the approach to image transcription in live cells with (+IAA) or without (untreated, UNT) PRC1 depletion. f, Box plots (as in b) corresponding to ON-period analysis for Zic2, E2f6 (Polycomb genes) and Hspg2 (reference) in untreated and PRC1-depleted conditions. Individual data points correspond to individual ON periods (at least 599 measured per box plot). Statistical significance was calculated as in a and P values < 0.05 are shown. For Hspg2 Pol II loading, P = 0.01376; for Hspg2 amplitude, P = 4.2704 × 10⁻⁵. Box plots represent data from four (Zic2), three (E2f6) and two (Hspg2) biological replicates. Source numerical data and unprocessed blots are available in Source data.

