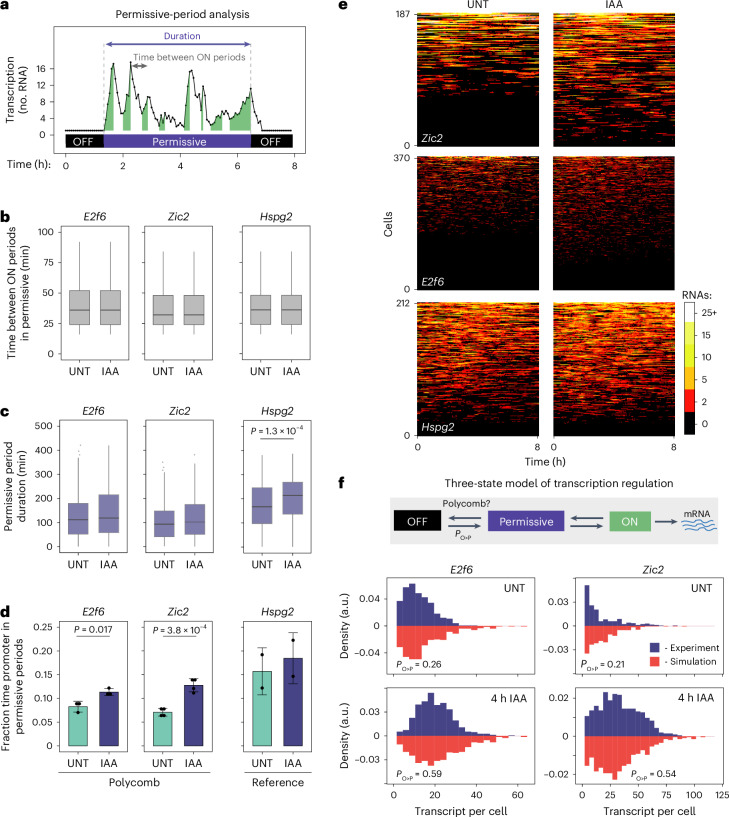
Fig. 3. PRC1 sustains a deep OFF state that is refractory to transcription and counteracts gene expression.
a, Schematic illustrating the features extracted from transcription imaging trajectories for permissive-period analysis. These include the time between ON periods within permissive periods (grey arrow) and the duration of permissive periods (purple arrow). b, Box plots centred on the median value comparing the time between ON periods for E2f6, Zic2 and Hspg2 in untreated or IAA-treated (PRC1-depleted) conditions showing the IQR, which is demarcated by the minimal and maximal value, and whiskers as 1.5× IQR. At least 1,010 instances of time intervals between ON periods represent each box plot. P values represent two-sided Kolmogorov–Smirnov and P values < 0.05 are shown. Box plots represent data from four (Zic2), three (E2f6) and two (Hspg2) biological replicates. c, Box plots (as in b) comparing the duration of permissive-periods for E2f6, Zic2 and Hspg2 in untreated or IAA-treated conditions. At least 212 durations of permissive period represent each box plot. Box plots represent data from four (Zic2), three (E2f6) and two (Hspg2) biological replicates. For Hspg2, P = 1.263 × 10⁻⁴. d, Bar graphs showing the fraction of total imaging time spent in permissive periods for E2f6, Zic2 and Hspg2. Data are mean and s.d. from four (Zic2), three (E2f6) and two (Hspg2) biological replicates. For E2f6, P = 0.01756; for Zic2, P = 3.850 × 10⁻⁴. e, Heat maps illustrating transcription imaging trajectories of individual cells for E2f6, Zic2 and Hspg2 in untreated or IAA-treated conditions over the 8-h imaging time course (horizontal axis). The amplitude of transcription is illustrated in the scale bar (right) and the number of imaging time courses is indicated on the y axis. Heat maps were randomly subsampled to represent equal number of measurements in untreated and IAA-treated conditions to facilitate qualitative comparison. f, Top: schematic illustrating the simple three-state model of transcription used to simulate gene expression distributions. Bottom: histograms comparing transcript per cell distributions from smRNA-FISH in experiments (blue bars, experimental) and simulations (red bars) for Polycomb genes in untreated or IAA-treated conditions. The best-fit PO>P value for both untreated and 4 h IAA-treated conditions are indicated. Source numerical data are available in Source data.

