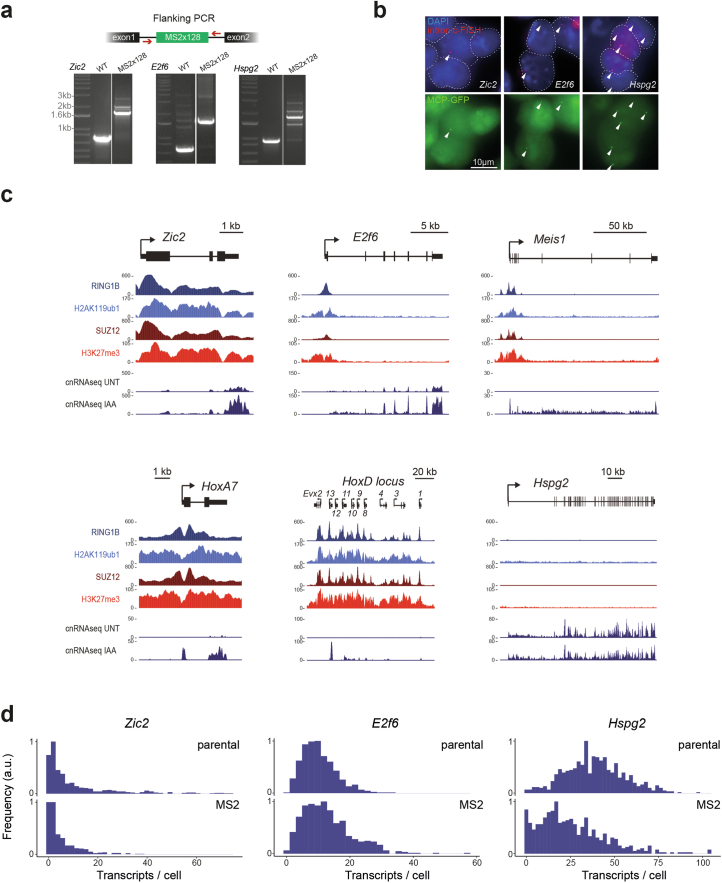
Extended Data Fig. 1. Characterisation of live-cell transcription imaging in ESCs.
(a) Validation that the MS2x128 array is appropriately inserted into the first intron of the corresponding gene. Top: a schematic illustrating the PCR screening strategy. Bottom: PCR results for Zic2, E2f6, and Hspg2. The experiment was repeated twice. (b) Images of intronic RNA-FISH (red) and focalized MCP-GFP signal (green) indicating that MCP-GFP accumulates at sites where intronic RNA sequences for Zic2, E2f6, and Hspg2 are identified. Nuclei are labelled with 4′,6-diamidino-2-phenylindole (DAPI, blue) and outlined with a dashed line. Representative of at least 10 images each. (c) Genomic cChIP-seq snapshots for Zic2, E2f6, Meis1, HoxA7, HoxD locus (Polycomb genes) and Hspg2 (non-Polycomb gene) illustrating signal for RING1B-AID, H2AK119ub1, SUZ12 and H3K27me3. cnRNA-seq signal before and after 4h RING1B-AID depletion is also shown. The data used is from Dobrinic et al.21. (d) smRNA-FISH analysis of transcript-per-cell distributions for parental (MCP-GFP expressing) and MS2x128 array-containing cell lines. Source numerical data are available in source data.

