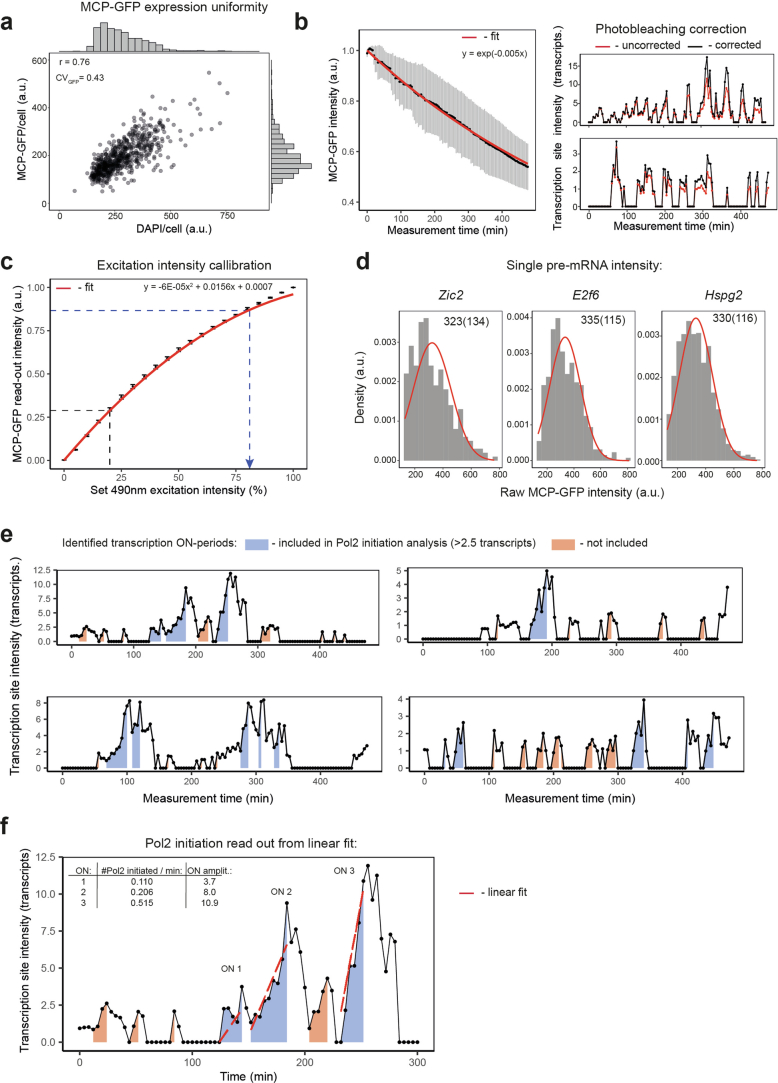
Extended Data Fig. 3. Characterisation of live-cell transcription imaging with single-transcript sensitivity and ON-period analysis.
(a) MCP-GFP expression is uniform across the cell population correlated with DNA content (DAPI signal) (n = 1). (b) (Left panel) Measurements of GFP photobleaching (grey datapoints) over a full time-course of live-cell-imaging approximated with an exponential decay (red line) that was used to correct fluorescence intensity in time-course transcription trajectories. (Right panel) Examples of the effect of this correction are presented on the right. (c) To measure the intensity of single pre-mRNAs containing 128 MS2 aptamers, imaging was performed using a higher 490nm excitation intensity. The curve quantifies MCP-GFP intensity (y-axis) in response to varying 490nm excitation levels. The blue dashed lines represent values used for live-cell transcription imaging and for single pre-mRNA intensity quantification (dashed line with arrow-head). This curve informed us of the 490nm intensity that excites GFP at 3x the value used in our live-cell transcription measurements. (d) Histograms of single pre-mRNA intensities recalculated in values corresponding to live-cell transcription measurements for Zic2, E2f6, and Hspg2. The red line represents a Gaussian fit with mean and standard deviation values indicated above. These values allowed us to recalculate fluorescence intensity units in order to attribute transcript numbers based on fluorescence intensity at the transcription site. Data represents single biological replicate. (e) Examples of live-cell transcription trajectories with identified ON-periods indicated in blue or orange depending on whether they were taken into account during RNA Pol II reinitiation rate estimations or not. All ON-periods were taken into account in amplitude and duration analysis. (f) An example of a live-cell transcription trajectory with three ON-periods (in blue) with their amplitudes and RNA PolII reinitiation rates (from linear fits, red dashed lines) indicated. Source numerical data are available in source data.

