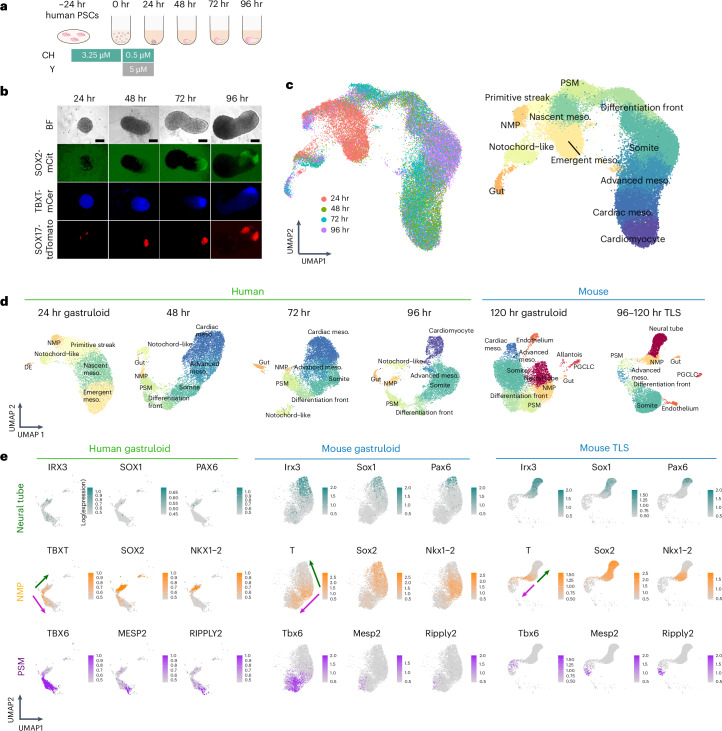
Fig. 1. Single-cell transcriptional profiling of a time-series of conventional human gastruloids.
a, Schematic of conventional human gastruloid protocol11. CH, CHIR99021; Y, Y-27632. b, Representative images of RUES2-GLR44. The experiments were repeated independently six times with similar results. SOX2-mCit, pluripotent and ectoderm marker; TBXT-mCer, mesoderm marker; SOX17-tdTomato, endoderm marker. Scale bar, 100 µm. c, Integrated UMAP of ~44,000 scRNA-seq profiles from four time points of human gastruloid development, coloured by time point (left) or cell type annotation (right). The 48 h to 96 h gastruloids were sequenced per time point. d, UMAP projection of scRNA-seq profiles from individual time points of human gastruloids (generated by this study based on published protocols11) or published data from mouse gastruloids10 or mouse TLSs15. PGCLC, primordial germ cell-like cell; DE, definitive endoderm. e, Normalized expression of marker genes for neural tube (top row), NMPs (middle row) or PSM (bottom row) in UMAP projections of scRNA-seq profiles of extracted cell types (neural tube, NMP and PSM cells) from human gastruloids at 96 h, mouse gastruloids at 120 h (ref. 10), or mouse TLS at 120 h (ref. 15). Arrows represent putative differentiation of NMPs toward neural tube (green) and PSM (purple) fates, respectively. The key point is that NMP-like and PSM-like cells are detected in all three models, but neural tube-like cells are detected only in the two mouse models. UMAP, Uniform Manifold Approximation and Projection.

