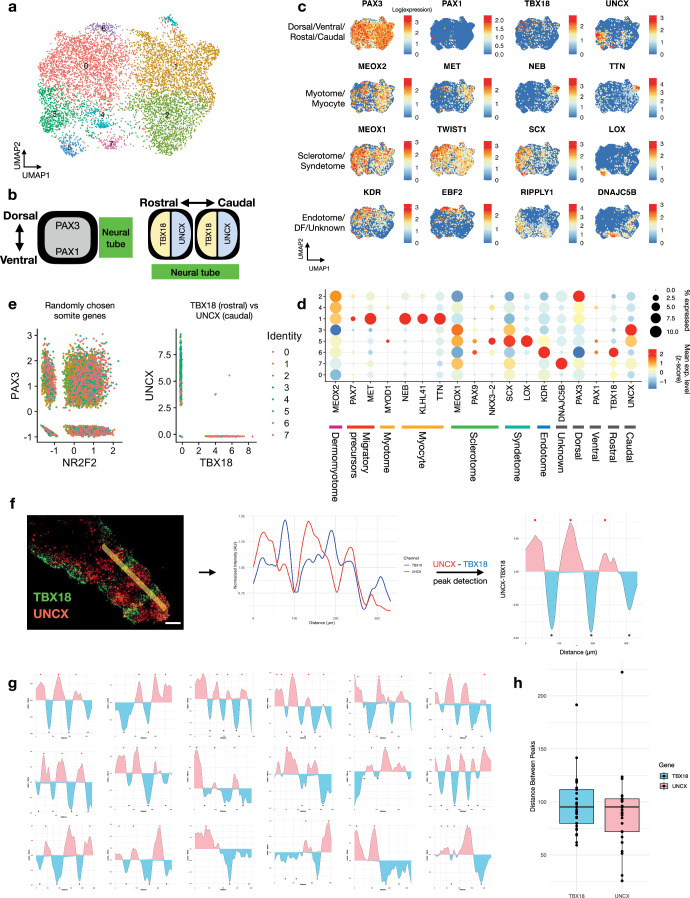
Extended Data Fig. 9. Markers of spatial patterning and differentiation in the somites of human RA-gastruloids.
a, Clustering and UMAP visualization of somite-related cell types (somite, differentiation front, myocyte) from scRNA-seq data of 120 h human RA-gastruloids. b, Schematic of dorsal-ventral and rostral-caudal axes of somites, with expected marker genes noted. c, Same UMAP as panel (a) showing expression of selected marker genes for various subtypes of cells within somites. DF, differentiation front. d, Bubble plot showing expression patterns of selected marker genes for clusters shown in panel (a). e, Scatter-plot showing scaled expression levels of randomly chosen pairs of genes (left) or TBX18 vs. UNCX (right). The expression of TBX18 and UNCX, markers of the rostral-caudal axis of somites, are mutually exclusive. f, (left) Representative image of HCR of UNCX and TBX18 in 120 h human RA-gastruloids, and quantification of the signal intensity along with the A-P axis. Scale bar, 50 µm. (middle) Signal intensities of TBX18 (blue) and UNCX (red) were measured on the yellow line of the left panel. Data was normalized with the mean values of each signal and processed with LOESS smoothing. (right). Line plot showing the difference between TBX18 and UNCX values. Red and blue dots indicate the peaks for UNCX-high (red) and TBX18-high (blue), respectively, detected by a findpeaks function of pracma R package. g, Similar line plots for 18 RA-gastruloids. h, Boxplot showing the distribution of the distances between successive TBX18-high (blue) or UNCX-high (red) peaks.

