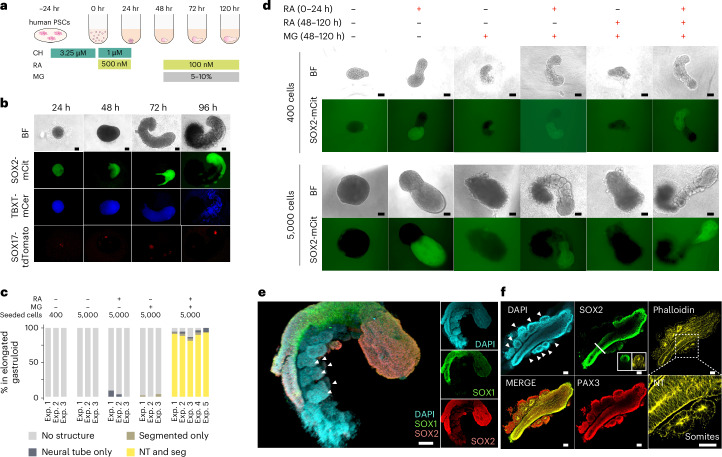
Fig. 2. Robust induction of human gastruloids with both a neural tube and segmented somites via a discontinuous regimen of retinoic acid.
a, Schematic of human RA-gastruloid protocol. MG, Matrigel; CH; CHIR99021. RA was applied for the first 24 h after induction, then withdrawn, then added back at 48 h along with 5–10% MG. b, Representative images of developing human RA-gastruloids. Scale bar, 100 µm. n = 768 (96 × 8 plates) human RA-gastruloids showed similar morphology (elongated gastruloid with flanking somites) and patterns of marker gene expression (asymmetric, elongated SOX2-mCit+ signal flanked by non-overlapping weak TBXT-mCer signal overlaying somites). c, Quantification of the frequency of NT elongation and somite segmentation under various experimental conditions. NT, neural tube; Seg, segmented somites. d, Representative images of gastruloids with or without RA/MG from 400 cells (top) or 5,000 cells (bottom). The concentration of RA at 0–24 h and 48–120 h was 500 nM and 100 nM, respectively. n = 24–48 per condition. The concentration of MG was 5%. Scale bar, 100 µm. e, 3D projections of immunostained 120 h RA-gastruloids. The SOX1+, SOX2+ region corresponds to the NT-like structure, flanked by somite-like structures. Arrowheads indicate paired somites. n = 12/13 human RA-gastruloids showed similar morphology (elongated gastruloid with flanking somites) and patterns of marker gene expression (asymmetric, elongated, coincident SOX1 and SOX2 staining that did not extend to flanking somites). Scale bar, 100 µm. f, Confocal section of immunostained 120 h RA-gastruloid. Phalloidin staining shows the apical accumulation of F-actin in SOX2+, PAX3+ NT and PAX3+ somites. Slice images of the area indicated in the bold line are shown in the SOX2 staining image. The magnified region in the phalloidin staining image is indicated by a dotted square. Arrowheads indicate paired somites. Scale bar, 100 µm. n = 9/11 human RA-gastruloids showed similar morphology (elongated gastruloid with flanking somites) and patterns of marker gene expression (asymmetric, elongated SOX2 staining flanked by PAX3 staining of flanking somites).

