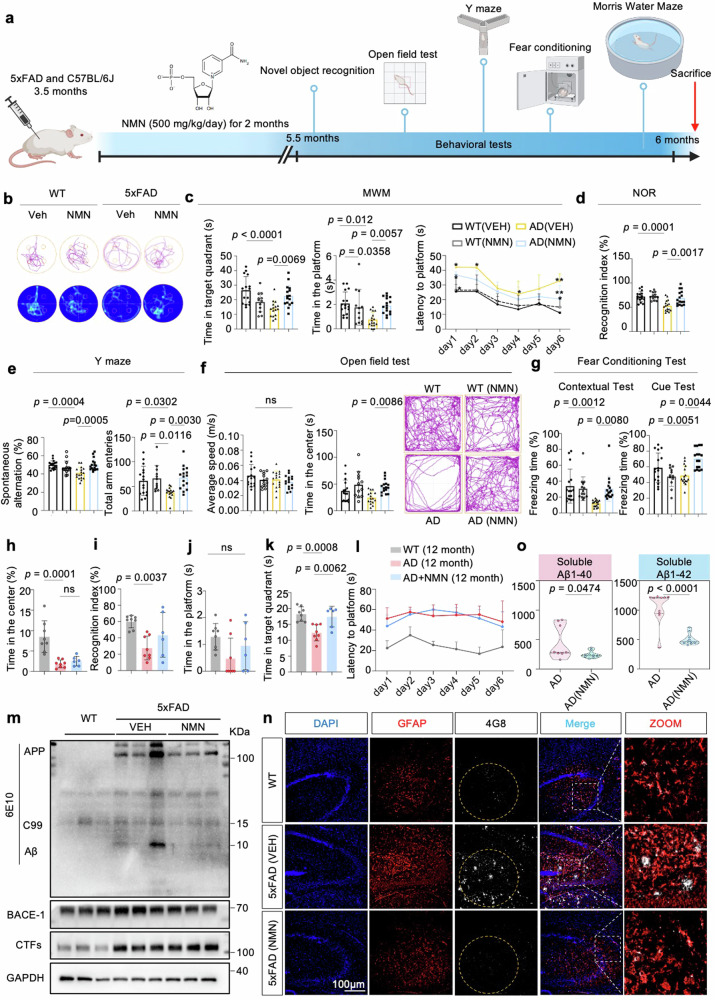
Fig. 4. NAD+ booster ameliorates cognitive decline and Aβ deposition in 5xFAD mice.
a A workflow diagram of NMN (500 mg/kg, intraperitoneal injection) treatment began at 3.5-month-old mice for 2 months. b–g The behavioral test results of 6-month-old mice. Data were analyzed by two-sided one-way ANOVA followed by Tukey’s multiple comparisons test. b The representative swimming tracks of mice from a probe trial day (n = 16 mice in WT (VEH), n = 16 mice in AD (VEH), n = 13 in WT (NMN), and n = 16 in AD (NMN)). c Spatial memory analysis of each group. Left, time in the target quadrant in the probe trial; center, platform frequency of mice passed through the platform in the probe trial at day 7; right, latency to escape to a hidden platform in the MWM during a 6-day training period. Data were analyzed by two-way ANOVA followed by Tukey’s multiple comparisons test. d–g New object recognition (d), Y maze (e), Open Field test (f), and contextual and cued fear conditioning (g) tests were performed. h, i The behavioral tests analysis as in (b–g) in 12-month-old mice (n = 13 mice in WT (VEH), n = 7 mice in AD (VEH), and n = 7 in AD (NMN)). New object recognition (i) and open Field test (h) tests were performed. j–l The results of MWM in each group in 12-month-old mice. Data were analyzed by one-way ANOVA followed by Tukey’s multiple comparisons test for (h–k), while two-way ANOVA was used for (l). m Effects of NMN on the expression levels of APP and its indicated metabolites, BACE-1, and CTFs hippocampal tissues from 5xFAD. Full-length APP, C99, and Aβ were detected with 6E10 antibody (n = 6 mice per group; one-way ANOVA). n Confocal images of 4G8+ GFAP+ double-positive cells from hippocampi of 6-month-old WT, 5xFAD and 5xFAD (NMN) mice. Insets were enlarged from hippocampal areas. Scale bar, 100 μm. The experiments were repeated from three independent experiments with the results shown as mean ± s.e.m. o Soluble and insoluble Aβ1–40 and Aβ1–42 levels in hippocampal tissues (n = 9 mice; two-sided unpaired t-test). All experiments were performed independently with at least three biological replicates. Data are shown as mean ± s.e.m. The p-values are indicated on the graphs. ns not significant.

