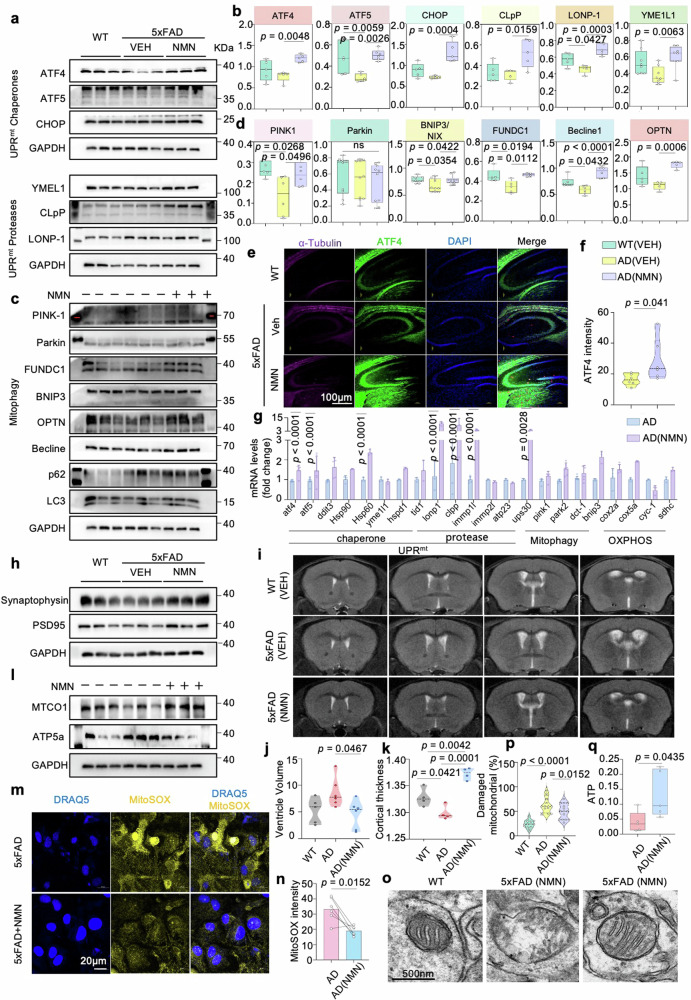
Fig. 5. Cross-species MSR signature attenuates mitochondrial dysfunction.
a, c Effects of NMN on the expression level of proteins involved in UPRmt and mitophagy in the 5xFAD mice hippocampi of individuals with and without NMN (n = 3 biologically independent samples; two-sided unpaired t-test). b, d Corresponding quantification of western blot data of (a, c) (n = 3 mice in each group). Data were analyzed by two-sided one-way ANOVA followed by Tukey’s multiple comparisons test. e, f Representative immunostained images (e) and quantification (f) of ATF4 in the hippocampi of AD (VEH) and AD (NMN) tissues (n = 3 mice; two-sided unpaired t-test). Scale bar, 100 μm. g The mRNA expression measurement of MSR signature after supplementing with NMN in 5xFAD mice (n = 3; two-way ANOVA). h Synaptic proteins from the 6-month hippocampi were analyzed by Western blotting (n = 3 mice in each group). Data were analyzed by two-sided one-way ANOVA followed by Tukey’s multiple comparisons test. i–k we obtained T2-weighted anatomical images to analyze the structure difference in the ventricle system using a 9.4 Tesla magnetic resonance imaging (MRI) scanner. Data were pooled from at least 3 biological replicates. Data were analyzed by two-sided one-way ANOVA followed by Tukey’s multiple comparisons test. l Mito-nuclear protein imbalance evaluated by the ratio of mitochondrial DNA (mtDNA)-encoded protein (MTCO1) and nuclear DNA (nDNA)-encoded protein (ATP5a) in three groups (n = 3 mice; one-way ANOVA). m, n Representative immunostaining and quantification of the MitoSOX in the cultured primary astrocytes (n = 6 mice; two-sided unpaired t-test). Scale bar, 20 μm. o, p Representative electron microscopic images, and multiple quantifications, showing the effects of NMN on mitochondrial morphology in mouse hippocampal brain tissues. The quantification was obtained in two independent experiments performed in duplicates in at least 20 ROIs. q ATP Assay was performed in 6-month-old AD mice brain (n = 5 mice, two-sided unpaired t-test). All experiments were performed independently with at least three biological replicates with similar results. Data are shown as mean ± s.e.m. The p-values are indicated on the graphs. ns not significant.

