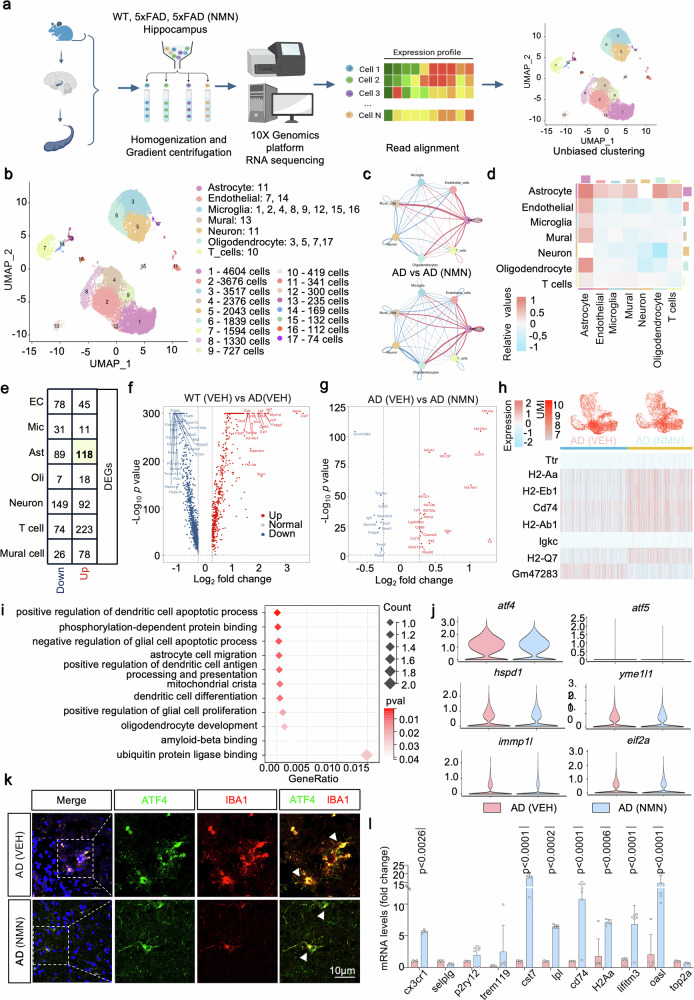
Fig. 7. scRNA-seq transcriptional signatures in microglia cells.
Brain hippocampal tissues from 6-month-old WT, 5xFAD, and 5xFAD treated with NMN (n = 2 per genotype) were subjected to this scRNA-seq. a Diagram of snRNA-seq workflow. b Two-dimensional uniform manifold approximation and projection (UMAP) plot showing 17 distinguished clusters of single-cell events captured in scRNA-seq. c, d Interaction number network plot (c, top), interaction strength network plot (c, bottom), and heat map (d) between different cell types in 5xFAD versus 5xFAD treated with NMN. e Number of up and downregulated different expression genes (DEGs) in different cell types. f, g Volcano plots illustrating upregulated or downregulated genes in the WT compared to 5xFAD (f) and 5xFAD versus 5xFAD treated with NMN (g) in microglia cells. h UMI feature plot and heat map of average gene expression of top DEGs in the microglia cluster from 5xFAD and 5xFAD+NMN mice. i Functional annotation of certain microglia clusters using GO pathways enriched for their signature genes (mitochondrial-related genes). j Violin plots showing average UPRmt-related gene-expression across microglia cells. k Confocal images of double immunostained with ATF4 (green) and IBA1 (red). The insert is a higher magnification of the boxed area showing the decreased level of ATF4 and upregulated level of IBA1. Arrowheads point to a colocalization of ATF4 and microglia. Scale bar, 10 μm. l Transcript levels of marker genes for microglia cluster identification in the hippocampal groups of 5xFAD and 5xFAD+NMN mice (n = 6 mice; two-way ANOVA). All experiments were performed independently with at least three biological replicates. Data are shown as mean ± s.e.m. The P-values are indicated on the graphs. ns not significant.

