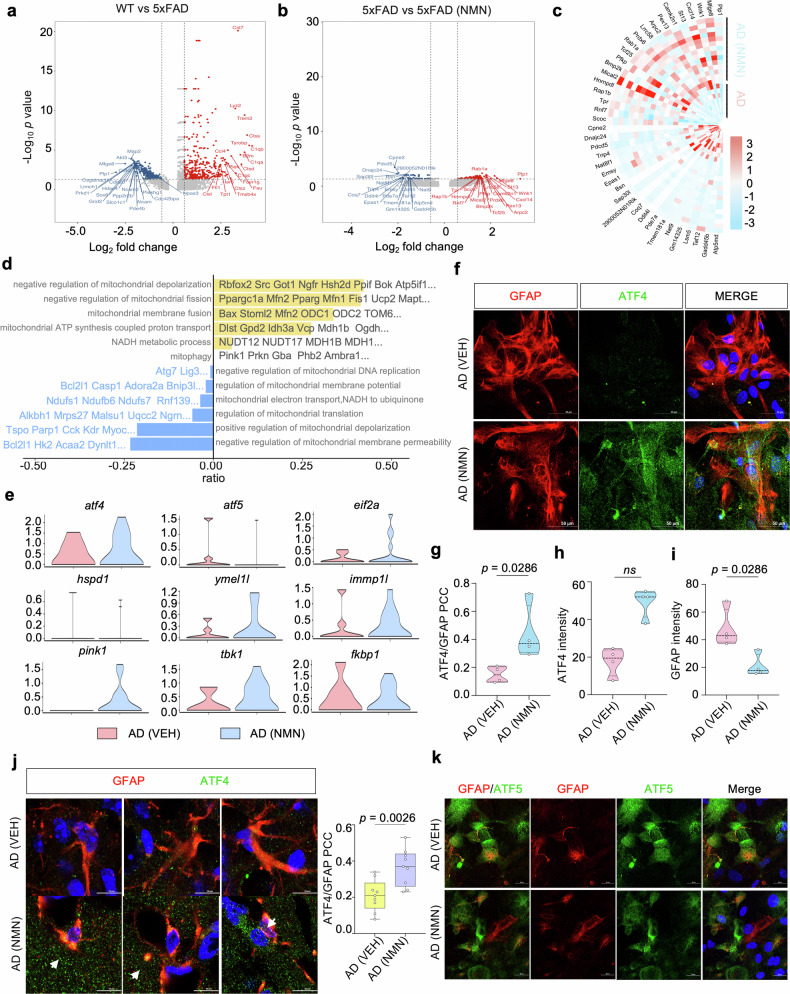
Fig. 8. ATF4-mediated MSR signatures can be enhanced by NMN in astrocytes.
a, b Volcano plots illustrating significant DEGs in the WT (VEH) compared to 5xFAD (VEH) and 5xFAD (VEH) versus 5xFAD (NMN) in astrocytes. c Heat map revealing the expression of DEGs in astrocytes from 5xFAD (VEH) compared to 5xFAD (NMN). d GVSA enrichment analyses for mitochondrial-related pathways in the astrocyte populations of 5xFAD and 5xFAD treated with NMN mice. e Violin plots indicating the mean and variance difference between 5xFAD and 5xFAD with NMN in the astrocytes clustering for UPRmt and mitophagy-associated genes. f–i Representative images of 5xFAD cultured primary astrocytes showing ATF4 staining with GFAP+ astrocytes. Scale bar, 50 μm. j Immunofluorescence labeling of 5xFAD and NMN-treated mouse brain with ATF4 and GFAP antibody. The arrow indicates GFAP+ astrocytes were high co-labeling with ATF4 in the NMN-treated AD mouse brain. The experiment was repeated twice independently with similar results. Scale bar, 10 μm. k Representative images of 5xFAD cultured primary astrocytes were subjected to co-immunostaining for GFAP and ATF5. Scale bar, 20 μm. All experiments were performed independently with at least three biological replicates. Data are shown as mean ± s.e.m. The p-values are indicated on the graphs. ns not significant.

