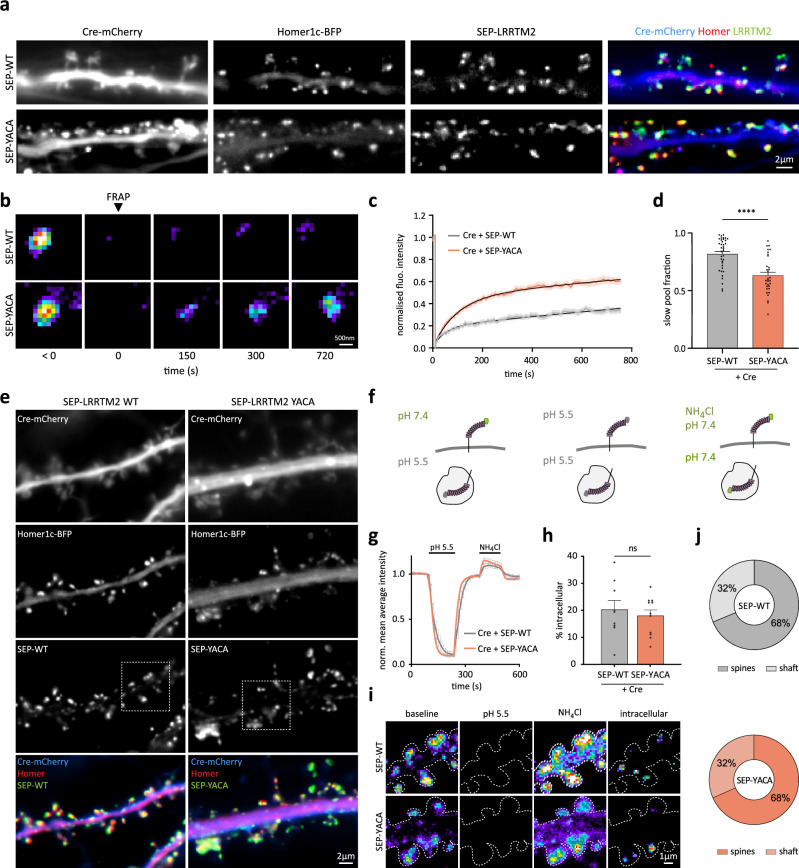
Fig. 3. The YxxC motif regulates LRRTM2 membrane turnover.
a Representative images of DIV15 hippocampal neurons expressing Cre-mCherry, Homer1c-BFP and either SEP-LRRTM2-WT or SEP-LRRTM2-YACA. On the right, Cre-mCherry (blue) is overlaid with Homer (red) and LRRTM2 (green). b Pseudocolor images of SEP fluorescence recovery after photobleaching in spines from neurons expressing Cre-mCherry and SEP-LRRTM2-WT or -YACA. c Corresponding normalized fluorescence recovery curves in spines and d slow pool fraction in both conditions. Data are presented as mean values ± SEM. Data acquired from three independent experiments (SEP-LRRTM2-WT: n = 37 regions, SEP-LRRTM2-YACA: n = 32 regions; ****p < 0.0001)). Data were compared by non-parametric Mann–Whitney test. e Representative images of DIV15 hippocampal neurons expressing Cre-mCherry (blue), Homer1c-BFP (red), and SEP-LRRTM2-WT or -YACA (green). Dashed squares indicate the positions of panel i. f Schematics of the pH change protocol used to visualize intracellular and extracellular protein pools. At pH 7.4, the SEP-tag is fluorescent, whereas at acidic pH (pH 5.5), its fluorescence is quenched. Bath application of pH 5.5 renders surface SEP-tagged proteins non-fluorescent, and NH4Cl de-acidifies intracellular vesicles, rendering intracellular SEP-tagged proteins fluorescent. g Normalized mean average intensity of SEP-LRRTM2-WT and SEP-LRRTM2-YACA overtime during the pH change protocol illustrated in f. Data are presented as mean values ± SEM. h Percentage of SEP-LRRTM2-WT and SEP-LRRTM2-YACA protein fluorescence signal localized in the intracellular compartments of dendrites. Data are presented as mean values ± SEM. Data were compared by non-parametric Mann–Whitney test. i Pseudocolor images of insets from (e) during the pH change protocol, revealing intracellular protein pools by subtraction of the “baseline” signal (extracellular) from the “NH4Cl” signal (total) in the shaft and spines. j Percentage of SEP-LRRTM2-WT and SEP-LRRTM2-YACA intracellular pool distribution in spines and dendritic shaft. g–i Data acquired from three independent experiments (SEP-WT: n = 9 and SEP-YACA: n = 11 cells).

