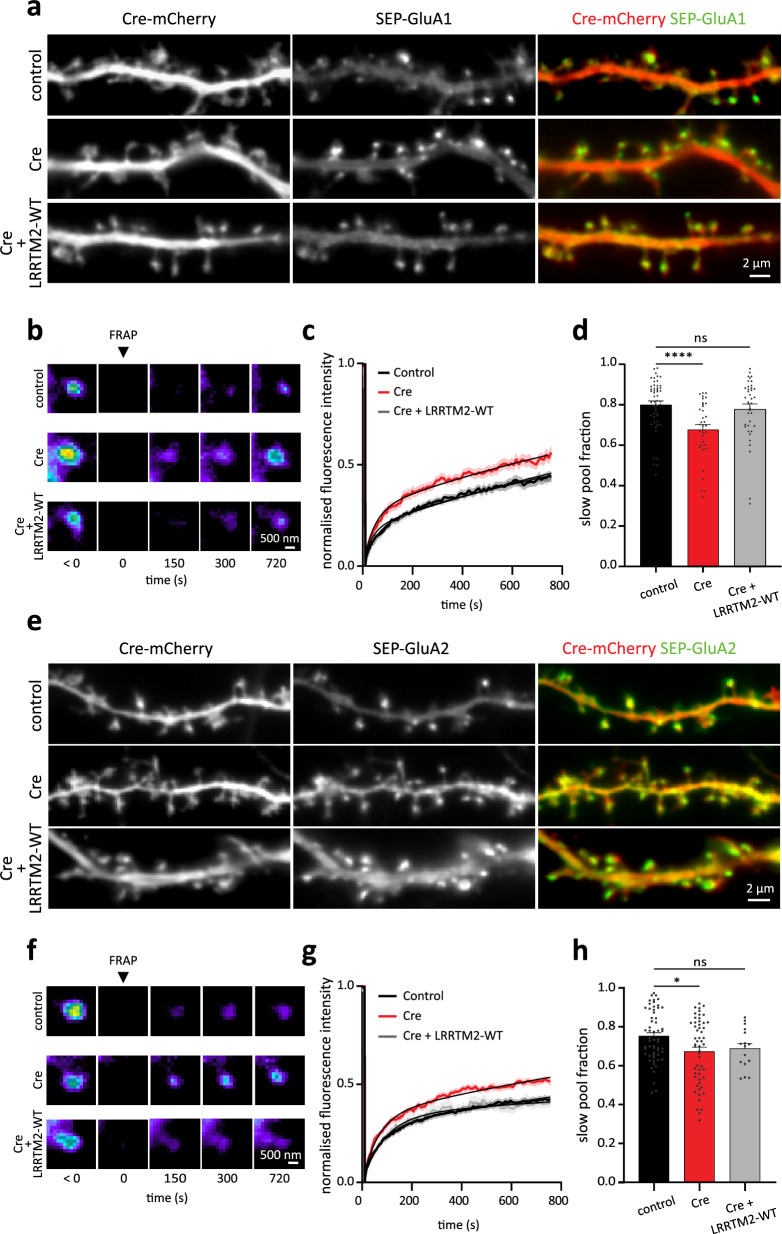
Fig. 4. LRRTM2 cKO impairs synaptic AMPAR stabilization.
a DIV15 hippocampal neurons expressing soluble mCherry and SEP-GluA1 subunit of AMPARs (control), Cre-mCherry and SEP-GluA1 (Cre) or mCherry, SEP-GluA1, BirAER and AP-LRRTM2-WT (Cre + LRRTM2-WT). On the right, mCherry (red) is overlaid with SEP-GluA1 (green). b Pseudocolor images of FRAP experiments performed on SEP-GluA1 localized in spines for the different conditions described in (a). c Corresponding normalized fluorescence recovery curves, showing faster recovery of SEP-GluA1 fluorescence in the absence of LRRTM2, and d slow pool fraction, showing a decrease of this fraction in the absence of LRRTM2. Data are presented as mean values ± SEM. Data obtained from three independent experiments (control: n = 51; Cre: n = 34; Cre + LRRTM2-WT: 39 regions, ****p < 0.0001). Data were compared by one-way analysis of variance test, followed by post hoc Dunn’s test. e DIV15 hippocampal neurons expressing soluble mCherry and SEP-GluA2 subunit of AMPARs (control), Cre-mCherry and SEP-GluA2 (Cre) or mCherry, SEP-GluA2, BirAER and AP-LRRTM2-WT (Cre + LRRTM2-WT). On the right, mCherry (red) is overlaid with SEP-GluA2 (green). f FRAP of SEP-GluA2 localized in spines for the different conditions described in (e), showing faster recovery in the absence of LRRTM2. g Corresponding normalized fluorescence recovery curves and h slow pool fraction show that GluA2 is less stabilized at synapses in the absence of LRRTM2. Data are presented as mean values ± SEM. Data obtained from three independent experiments (control: n = 58; Cre: n = 55; Cre + LRRTM2-WT: n = 16 regions, *p < 0.05). Data were compared by one-way analysis of variance test, followed by post hoc Dunn’s test.

