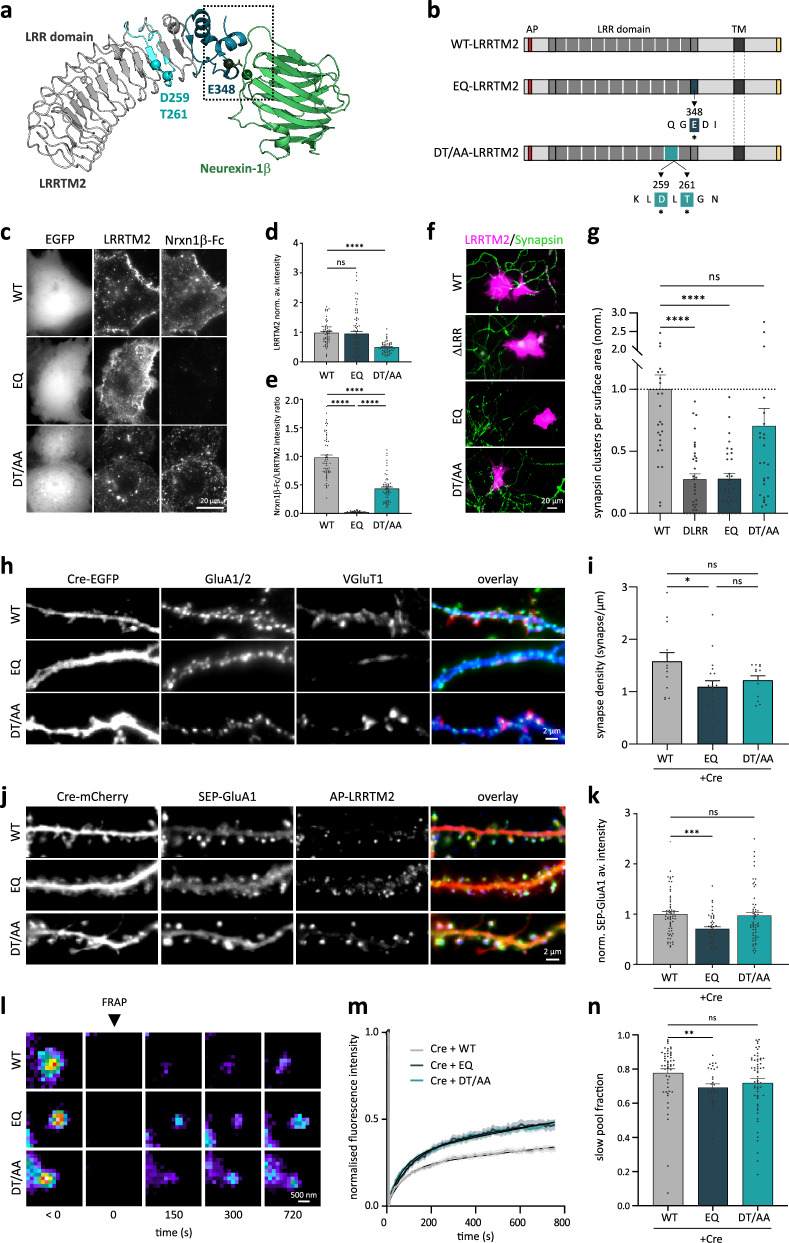
Fig. 5. LRRTM2 controls synaptic AMPAR stabilization through neurexin-binding site.
a Crystal structure of hLRRTM2 (gray) in complex with Neurexin-1β (green) (PDB 5Z8Y), showing interaction site E348 recently identified14 (dark blue) and calcium ion (green), and D259 and D26115 (light blue). b Schematics of EQ- (E348 mutated to Glutamine (Q)) and DT/AA- LRRTM2 (D259/T261 mutated to Alanines (A)). c COS-7 cells expressing EGFP and biotinylated WT-, EQ-, or DT/AA- LRRTM2, labeled with mSA-ATTO565, incubated with Nrxn1β-Fc and antiFc-A647. No Nrxn1β-Fc at EQ-LRRTM2 cell surface, showing disrupted binding. d Normalized average surface intensity of LRRTM2. e Average surface intensity of Nrxn1β-Fc normalized to expression levels of AP-LRRTM2, showing total disruption of Nrxn1β-binding exclusively with EQ. Data from three independent experiments (cells, WT: n = 60, EQ: n = 77, DT/AA: n = 62) ****p < 0.0001. f Co-culture showing recruitment of endogenous presynaptic synapsin1 (green) onto COS-7 cells expressing WT-LRRTM2 or DT/AA-LRRTM2, but not ΔLRR- or EQ-LRRTM2 (magenta) and g corresponding quantifications showing loss of synapsin1 recruitment in absence of LRR domain or mutation of E348, but not mutation of D259/T261. Data from three independent experiments (cells, WT: n = 29, ΔLRR: n = 35, EQ: n = 31, DT/AA: n = 27, ****p < 0.0001). h DIV15 neurons expressing Cre-EGFP, BirAER, and WT-, EQ- or DT/AA-LRRTM2 labeled for endogenous GluA1/2 and VGluT1 and i corresponding quantifications of synapse density (GluA1/2/VGluT1 apposition), showing specific decreased density upon EQ mutation. Data from three experiments (cells, WT: n = 14, EQ: n = 20, DT/AA: n = 13) *p < 0.05. j DIV15 neurons expressing Cre-mCherry, SEP-GluA1, BirAER and WT-, EQ- or DT/AA-AP-LRRTM2. k Normalized average intensity of spine SEP-GluA1, showing decreased intensity with EQ-LRRTM2 (regions, WT: n = 60, EQ: n = 45, DT/AA: n = 57), ***p < 0.001. l SEP-GluA1-containing spines before and after FRAP, m normalized FRAP curves in spines and n corresponding slow pool fraction, showing a selective reduction in EQ-LRRTM2. Data from three independent experiments (regions, WT: n = 50, EQ: n = 31, DT/AA: n = 59), **p < 0.01. d, e, g, i, k, n Data presented as mean values ± SEM, compared by one-way analysis of variance test, followed by post hoc Dunn’s test.

