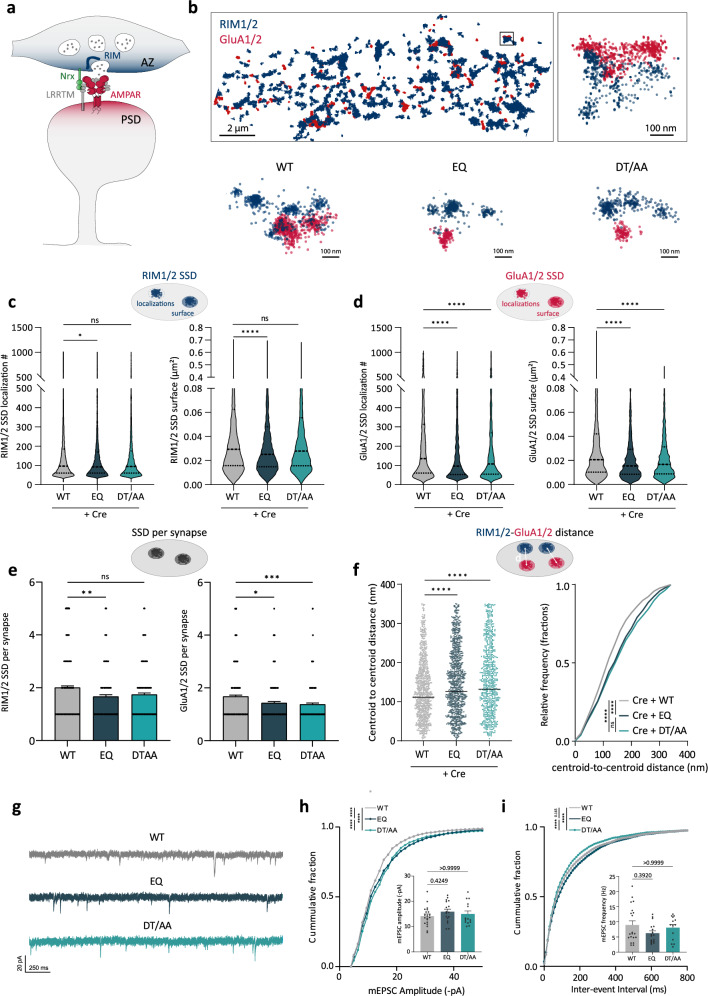
Fig. 6. The Neurexin-binding site E348 is required for the nanoscale organization of presynaptic RIM scaffolds and postsynaptic AMPA receptors.
a Schematics of trans-synaptic nanocolumns, where postsynaptic AMPARs anchored by PSD-95 scaffolds are aligned in front of release sites organized by presynaptic scaffolds such as RIM. b Example of reconstructed images from dual-color dSTORM of endogenous RIM1/2 (blue) and GluA1/2 (red) in the control condition (WT), showing apposition between RIM and AMPAR nanoclusters. Below are representative examples of RIM1/2-GluA1/2 apposition in different conditions showing disruption of GluA1/2 nanoscale organization in the presence of EQ and DT/AA compared to WT, and selective disruption of presynaptic RIM nano-organization in EQ condition. c Quantifications of RIM1/2 localizations in subsynaptic densities (SSDs) and RIM1/2 cluster surface, showing a selective decrease in EQ condition, but not in DT/AA condition. d Quantifications of GluA1/2 localizations in SSDs, and cluster surface, showing a decrease with both EQ and DT/AA mutants. e Quantifications of RIM1/2 and GluA1/2 SSD number per synapse, depicting a specific decrease of RIM1/2 SSD only with the EQ mutant. Data presented as mean values ± SEM. f Quantifications of the mean distances between RIM1/2 and GluA1/2 SSD centroids and relative frequency distribution of these distances, showing the increased distance between presynaptic scaffolds and postsynaptic AMPARs in the mutant conditions. Data obtained from three independent experiments (WT: n = 8; EQ: n = 10; DT/AA: n = 8 cells), *p < 0.05, **p < 0.01, ***p < 0.001, ****p < 0.0001. Data were compared by one-way analysis of variance test, followed by post-hoc Dunn’s test. g Representative mEPSC traces recorded from DIV15 hippocampal neurons expressing Cre-GFP, BirAER, and WT-, EQ-, or DT/AA- LRRTM2. h Cumulative graph and plot of mean mEPSC amplitudes, showing a significant shift of mEPSC amplitudes in the mutant conditions compared to WT. Data presented as mean values ± SEM. i cumulative graph of inter-event interval and plot of mean mEPSC frequency. Data presented as mean values ± SEM. Data acquired from three independent experiments (WT, n = 20; EQ, n = 17; DT/AA, n = 14) ****p < 0.0001. Data were compared by one-way analysis of variance test, followed by post-hoc Dunn’s test.

