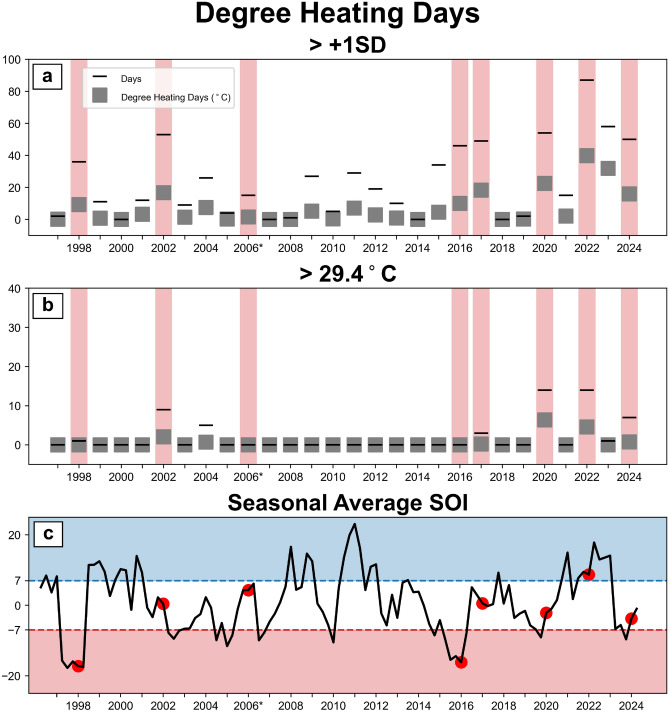
Figure 3.
Event comparison during the 1996–2024 December–April periods. Coral bleaching years are indicated in red. The area between the Davies Reef daily average ocean temperature and the +1SD curve (a) and above 29.4 C (b) are shown by the squares (degree heating days), while the number of days represented by the horizontal line. It is important to note that the event comparison used in this study is location specific to Davies Reef. Thus, as 2006 (southern GBR localised bleaching) is the only reported bleaching year not to influence the central GBR (or Davies Reef), its true intensity will not be present in this analysis. Data was not available for during April 23–30 2024, which may have a small impact on the +1SD value but not the 29.4 C threshold. Panel (c) shows the Bureau of Meteorology seasonally averaged Southern Oscillation Index (SOI) for 1996–2024. Red markers indicate the eight GBR CBEs. SOI values >7 indicate La Niña periods and SOI values < − 7 indicate El Niño periods.

