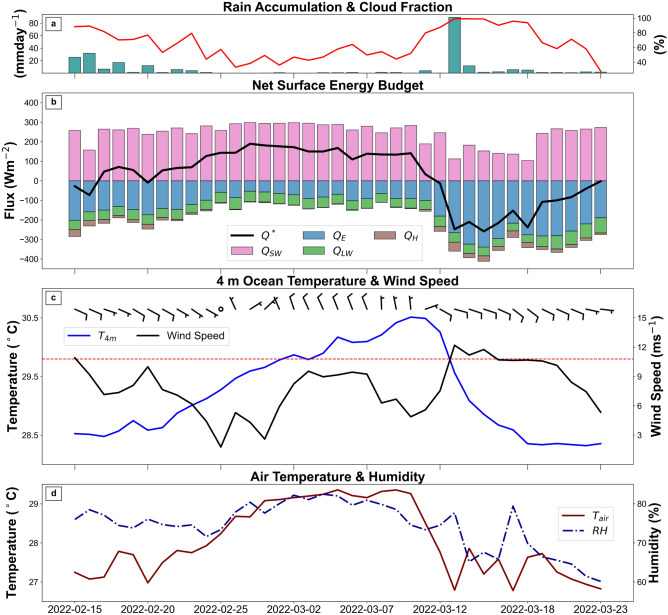
Figure 5.
Davies Reef daily averages between February 15-March 23, 2022. Panel (a) shows the 1 daytime cloud fraction for Davies Reef using Himawari-8/AHI satellite data and AIMS daily accumulated precipitation. Panel (b) shows the ERA5 net surface energy budget. The stacked bar chart shows the individual flux components; short-wave (, pink), long-wave (, green), sensible heat (, brown) and latent heat (, blue), where positive (negative) values represent incoming (outgoing) flux. Panel (c) shows AIMS observational ocean temperature at 4 m (blue) vs AIMS surface wind speed (black) and wind barbs (ms) with the 29.8 C local bleaching threshold (red dashed). Panel (d) shows AIMS surface air temperature (maroon) vs surface relative humidity (blue dashed).

