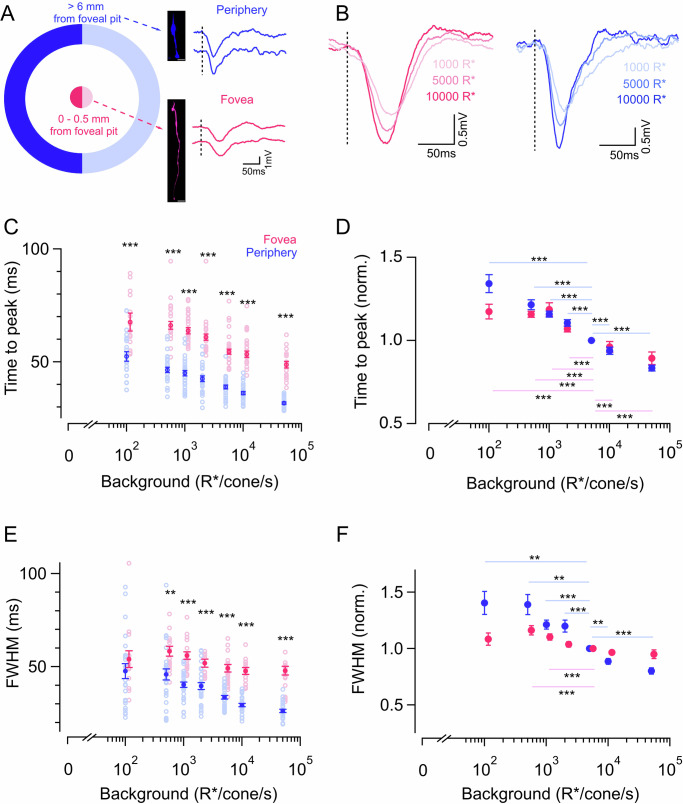
Fig. 1. Cone kinetics accelerate in the foveal and peripheral retina with increasing background luminance.
A Schematic showing the exact location of the foveal and peripheral retina and colors used throughout the figures. Measured from the center of the foveal pit, 0–0.5 mm was defined as foveal (magenta) and >6 mm was defined as peripheral (blue) retina. Insets show a cell-fill image of a foveal cone (scale bar - 35 µm) and peripheral cone (scale bar - 10 µm) and exemplar voltage responses of a foveal and peripheral cone to a 10 ms light flash (300% contrast) delivered on a background of 5000 R*/s. The vertical dotted lines denote the timing of the light flash. B Exemplar voltage response from a foveal cone (left) and peripheral cone (right) to 10 ms light flashes (300% contrast) at three background light levels. Note the speeding up of voltage responses with higher background light levels. C Times to peak of cone flash responses in foveal and peripheral retina across background light levels. The number of foveal and peripheral cones are denoted as nf and np, respectively for all figures. Time to peak of foveal and peripheral cone responses at 100 (nf = 16; np = 24), 500 (nf = 21; np = 28), 1000 (nf = 25; np = 30), 2000 (nf = 19; np = 28), 5000 (nf = 30; np = 30), 10,000 (nf = 25; np = 30), and 50,000 R*/s (nf = 19; np = 28) background light intensities, respectively. Empty circles represent individual data points and filled circles with error bars indicate the mean ± standard error of the mean (sem) for all figures. The time to peak of foveal cone responses is significantly slower compared to that of the peripheral cone responses. D Mean ± sem relative times to peak across backgrounds in foveal and peripheral cones. In each cell, the time to peak at each background was normalized by the time to peak at 5000 R*/s in that cell (calculated from cells represented in B). Note the decrease in the relative times to peak for both foveal and peripheral cones with increasing background light levels. E Full-width at half maxima (FWHM) of foveal and peripheral cone flash responses shown in C across the same background light levels. The FWHM of foveal cone responses is significantly slower compared to that of the peripheral cone responses for most of the background light levels. F Mean ± sem relative FWHM across backgrounds in foveal and peripheral cones. In each cell, the FWHM at each background was normalized by the FWHM at 5000 R*/s in that cell (calculated from cells in E). Source data are provided as a Source data file. For C, E, we performed multi-way ANOVA with multi-way comparison depending on the number of conditions compared. We used a one-sample t-test for (D, F). The significance threshold was placed at α = 0.05 (n.s., p > 0.05; *p < 0.05; **p < 0.01; ***p < 0.001).

