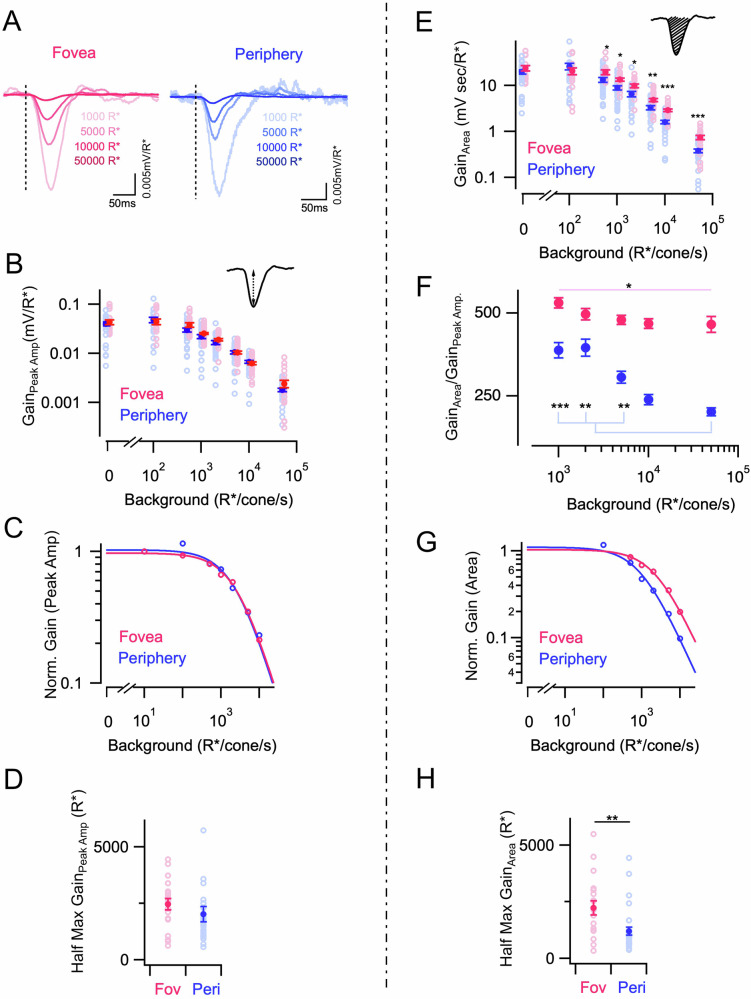
Fig. 2. Foveal cones exhibit weaker luminance adaptation than peripheral cones.
A Exemplar response of a foveal (left) and peripheral cone (right) to 10 ms light flashes at different background light levels. Responses have been converted into gain (mV/R*). Both foveal and peripheral cone responses show a reduction in gain with increasing background luminance. B Adaptation of peak response amplitude in foveal and peripheral cones. Peak response gains were measured at 0 (darkness; nf = 21; np = 28), 100 (nf = 16; np = 24), 500 (nf = 21; np = 28), 1000 (nf = 26; np = 30), 2000 (nf = 18; np = 28), 5000 (nf = 30; np = 30), 10,000 (nf = 26; np = 30) and 50,000 R*/s (nf = 20; np = 28) background light intensities, respectively. Peak response gain is not significantly different between foveal and peripheral cones across background luminance. Lighter open circles represent values from individual cells and points with error bars represent mean ± sem for all panels. C Normalized response gains (peak amplitude) across the luminance of an exemplar foveal and peripheral cone were fit to Eq. 1 described in the methods section. The solid line shows fit of Eq. 1 to an exemplar foveal and peripheral cone, demonstrating that cone adaptation is well described by this equation. D Half-maximal background luminance estimated from fits of peak amplitude gain across luminance to Weber–Fechner curve (Eq. 1) for foveal (nf = 19) and peripheral (np = 30) cones. Half-maximum background luminance is not significantly different between foveal and peripheral cones. E Adaptation of integrated responses (area under the curve) in foveal and peripheral cones shown in (C). Integrated response gains were calculated at the same background light intensities as (C). Integrated response gain is significantly different between foveal and peripheral cones starting at 500 R*/s background luminance. F Ratio of peak response amplitude and response integral (area under the curve) in foveal and peripheral cones across 1000 (nf = 25; np = 30), 2000 (nf = 18; np = 28), 5000 (nf = 25; np = 30), 10,000 (nf = 26; np = 30) and 50,000 R*/s (nf = 10; np = 28) background luminance. G Normalized response gains (area under the curve) across the luminance of an exemplar foveal and peripheral cone were fit to Eq. 1 described in the methods section. The solid line shows the fit of Eq. 1 to an exemplar foveal and peripheral cone, demonstrating that cone adaptation is well described by this equation. H Half-maximal background luminance estimated from fits of integrated gain across luminance to Weber–Fechner curve (Eq. 1) for foveal (nf = 19) and peripheral (np = 30) cones. The half-maximal background is significantly different between the foveal and peripheral cones. Source data are provided as a Source Data file. For figure panels with multiple comparison groups, we performed multi-way ANOVA with multi-way comparison depending on the number of conditions compared. We used the unpaired t-test for panels with two comparison groups (D, H). For figure panels with multiple comparison groups, we performed multi-way ANOVA with multi-way comparison depending on the number of conditions compared (B, E, andF). The significance threshold was placed at α = 0.05 (n.s., p > 0.05; *p < 0.05; **p < 0.01; ***p < 0.001).

