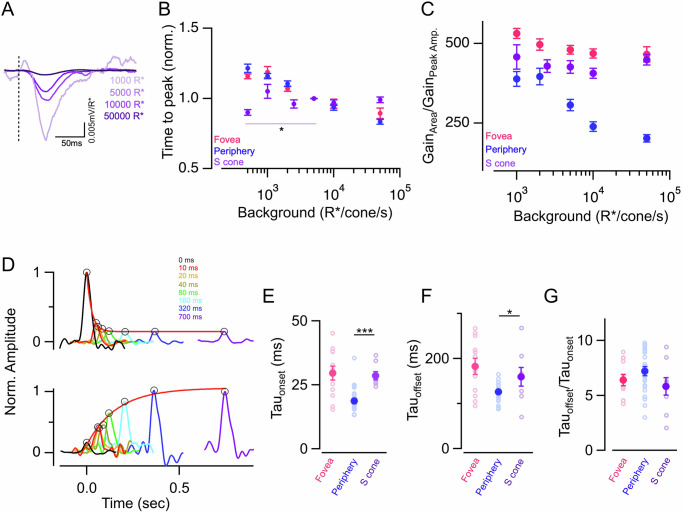
Fig. 6. Weaker and slower luminance adaptation in peripheral S vs L/M cones.
A Exemplar responses of a peripheral S cone to 10 ms light flashes at four different background light levels. Responses have been converted into gain (mV/R*). S cone responses show a reduction in gain with increasing background luminance. B Mean ± sem relative times to peak across backgrounds in foveal M/L, peripheral S, and peripheral M/L cones. In each cell, the time to peak at each background was normalized by the time to peak at 5000 R*/s in that cell. Note that, the relative times to peak for peripheral S cones do not change with increasing background light level. Normalized times to peak were plotted from n = 14, 9, 8, 25, 10, 25 peripheral S cones at 500, 1000, 2500, 5000, 10,000, and 50,000 R*/s background light intensities, respectively. Data for foveal and peripheral M/L cones replotted from Fig. 1. C Ratio of peak response amplitude and response integral in foveal M/L, peripheral S, and peripheral M/L cones. The ratio of amplitude vs integrated response gain was measured from n = 9, 8, 10, 10, 10 peripheral S cones at 1000, 2500, 5000, 10,000, and 50,000 R*/s background light intensities, respectively. Data for foveal and peripheral M/L cones replotted from Fig. 2. D The top panel shows rapid gain changes of the peripheral S cone at the light onset. The kinetics of the gain changes were estimated similarly to that in Fig. 3. The time constant of the exponential fit was tauonset = 34.5 ms (red smooth line). The bottom panel shows the time course of gain changes at light offset. The time constant of the exponential fit for this exemplar peripheral S cone was tauoffset = 384.7 ms (red smooth line). E–G The time course of gain changes at step onset of foveal, peripheral S, and peripheral M/L cones for light steps (5000–50,000 R*/s). The time constant at light onset, offset, and their ratios were calculated from n = 8 S cones. Lighter open circles represent peak response gains from each cell. Foveal and peripheral M/L cone data have been replotted from Fig. 3. Points with error bars represent mean ± sem. Source data are provided as a Source Data file. We performed multi-way ANOVA with a multi-way comparison with three conditions. The significance threshold was placed at α = 0.05 (n.s., p > 0.05; *p < 0.05; **p < 0.01; ***p < 0.001).

