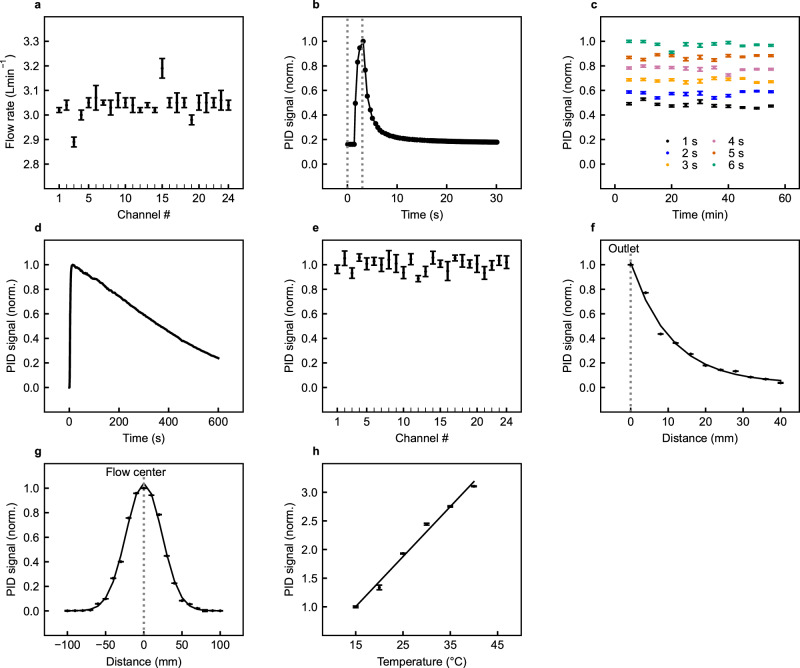
Fig. 2. Device performance.
a Measured airflow rates for the 24 outlet channels of the odor delivery device. Mean and standard deviation calculated from a set of n = 50 repeat measurements. b Transient response of the photoionization detector (PID) to an odor exposure generated by the odor delivery device with a 3 s activation time (activation time indicated by the dotted lines). c Temporal stability of the odor intensity generated by the odor delivery device over a 1 h time window with 1, 2, 3, 4, 5, and 6 s activation times. d Temporal stability of the odor intensity generated by the odor delivery device over a 600 s (10 min) time window with continuous activation. e Channel-to-channel variation in odor intensity generated by the odor delivery device for 3 s activation times. f Spatial distribution of odor intensity, measured over a distance of 40 mm from the outlet of the odor delivery device, in the direction of odor flow. g Spatial distribution of odor intensity measured across the path of odor flow, at a distance of 100 mm from the outlet of the odor delivery device. h Thermal response, showing the variation in measured odor intensity from the odor delivery device with ambient temperature. The mean and standard deviation for all PID measurement data points were calculated from a set of n = 10 repeat measurements.

