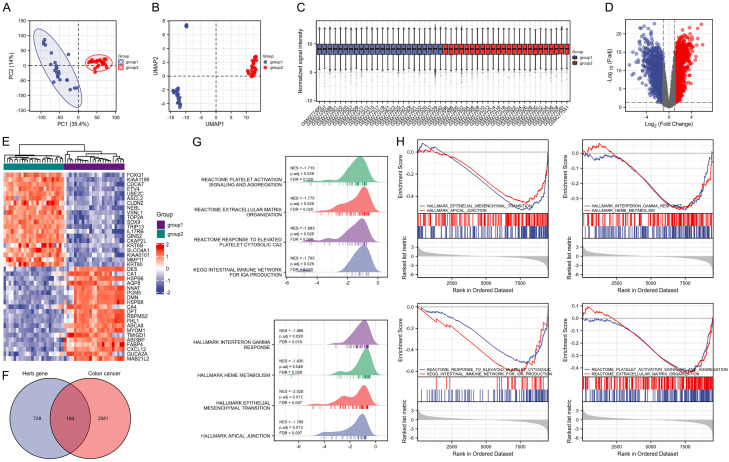
Figure 2.
Identification of differentially expressed genes (DEGs) in colon cancer (CC) and drug-disease targets. (A) Principal component analysis and (B) uniform manifold approximation and projection plots of group 1 (normal tissue samples) and group 2 (CC tumor samples) based on the Gene Expression Omnibus (GEO) database (GSE10972). (C) Box plot of normalized data in groups 1 and 2. (D) Volcano plot of DEGs in CC in the GEO database (GSE10972) under the condition of logFC>1 and adjusted P value <0.05. Red indicates the up-regulated genes and blue represents the down-regulated genes. (E) Heat map of the top 20 up-regulated genes and top 20 down-regulated genes in CC. (F) Venn diagram of the intersected genes between targets of active components in FZSBD and the DEGs in CC. (G, H) Gene set enrichment analysis (GSEA) showed the enrichment of drug-disease targets in hallmark pathways.

