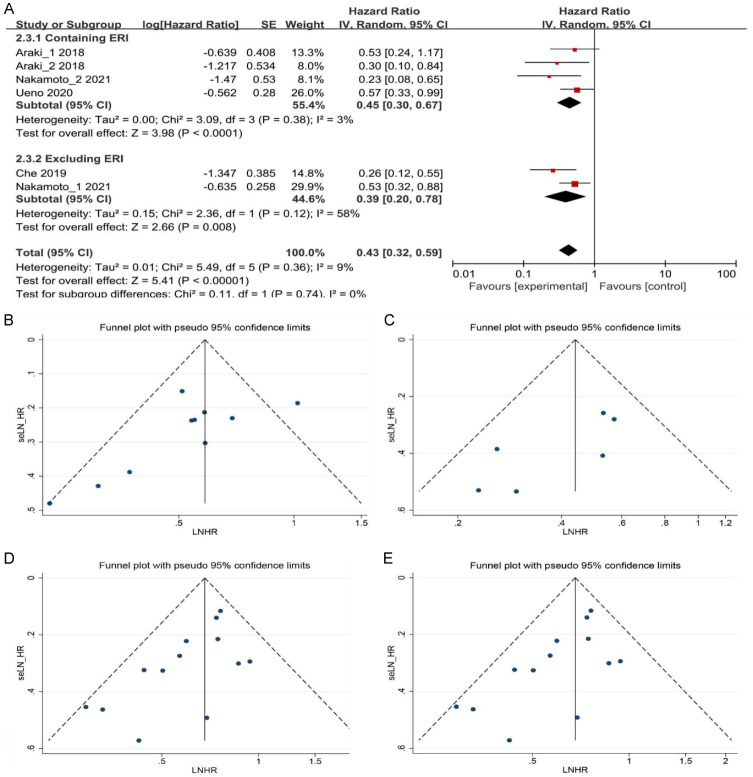
Figure 3.
A. Forest plots for the fixed-effect meta-analysis of the association between high ALC and PFS, TTF, and PPS by different chemotherapy regimens. B and C. Funnel plot for publication bias in the association between high ALC and PFS, TTF, and PPS by univariate and multivariate analyses. D and E. Funnel plot for publication bias in the association between high ALC and OS by univariate and multivariate analyses. Each study is represented by one circle. A vertical line represents the pooled effect estimate. HR, hazard ratio; CI, confidence interval; ALC, absolute lymphocyte count; PFS, progression-free survival; TTF, time to treatment failure; PPS, post-progression survival; OS, overall survival; LNHR, Logarithm of the Negative Hazard Ratio; seLN_HR, Standard Error of the Logarithm of the Negative Hazard Ratio.

