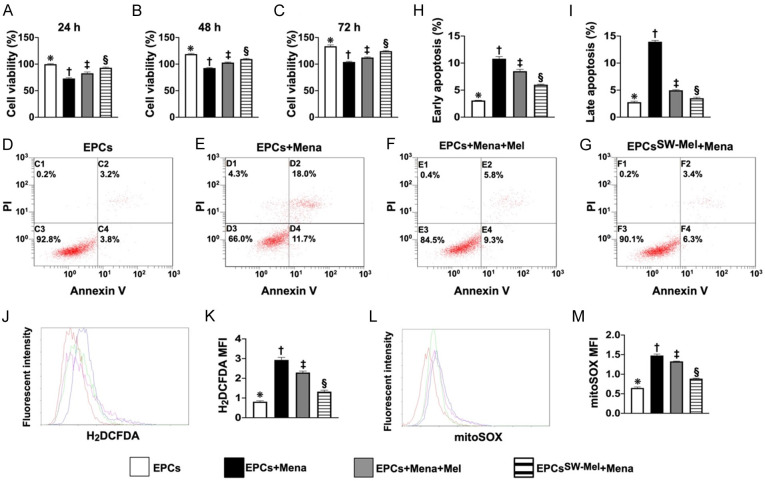
Figure 1.
Cell viability, cellular apoptosis, and reactive oxygen species (ROS). A. MTT assay for determining the cell viability at time point of 24 h, * vs. other groups with different symbols (†, ‡, §), P<0.0001. B. MTT assay for determining the cell viability at the time point of 48 h, * vs. other groups with different symbols (†, ‡, §), P<0.0001. C. MTT assay for determining the cell viability at the time point of 72 h, * vs. other groups with different symbols (†, ‡, §), P<0.0001. D-G. Flow cytometric analysis for identification of cell apoptosis. H. Flow cytometric analysis for determining the number of early cellular apoptosis cells (AN-V+/PI-), * vs. other groups with different symbols (†, ‡, §), P<0.0001. I. Flow cytometric analysis for determining the number of late cellular (AN-V+/PI+), * vs. other groups with different symbols (†, ‡, §), P<0.0001. J. Flow cytometric analysis for identification of total intracellular ROS. K. Flow cytometric analysis for assessment of mean fluorescent intensity of total intracellular ROS (i.e., stained carboxy-H2DCFDA dye), * vs. other groups with different symbols (†, ‡, §), P<0.0001. L. Flow cytometric analysis for identification of mitochondrial ROS. M. Flow cytometric analysis for assessment of mean fluorescent intensity of mitochondrial ROS, * vs. other groups with different symbols (†, ‡, §), P<0.0001. All statistical analyses were performed by one-way ANOVA, followed by Bonferroni multiple comparison post hoc test (n = 4 for each group). Symbols (*, †, ‡) indicate significance for each other (at 0.05 level). EPCs = endothelial progenitor cells; Mel = melatonin; Mena = menadione. A1 = EPCs only; A2 = EPCs + Mena; A3 = EPCs + Mena + Mel; A4 = EPCSW-Mel + Mena.

