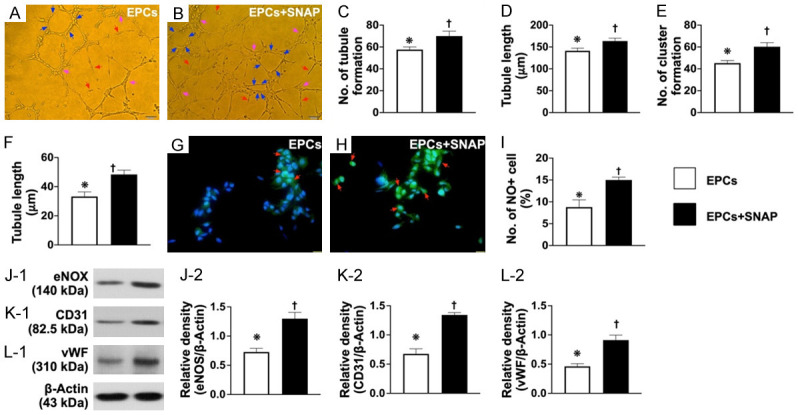
Figure 3.

SNAP treatment upregulated angiogenesis, NO production, and generation of soluble angiogenesis factors. A and B. Angiogenesis feature by Matrigel assay showed that the angiogenesis capacity was significantly increased in EPCs treated by SNAP compared to EPCs only (i.e., control group). C. Number of tubules formed (red arrows), * vs. †, P<0.0001. D. Tubule length, * vs. †, P<0.0001. E. Number of clusters formed (pink arrows), * vs. †, P<0.0001. F. Number of networks formation (blue color), * vs. †, P<0.0001. G and H. Immunofluorescent microscopic findings (400 ×) for identification of positively stained nitric oxide (NO) cells (green color) (red arrows). Scale bar in right lower corner represents 20 µm. I. Analytical result of number of NO+ cells, * vs. †, P<0.0001. J. Protein expression of endothelial nitric oxide synthase (eNOS), * vs. †, P<0.0001. K. Protein expression of CD31, * vs. †, P<0.0001. L. Protein expression of von Willebrand factor (vWF), * vs. †, P<0.0001. n = 4 for all groups. SNAP = S-nitroso-N-acetyl-DL-penicillamine; EPCs = endothelial progenitor cells; B1 = EPCs only; B2 = EPCs + SNAP.
