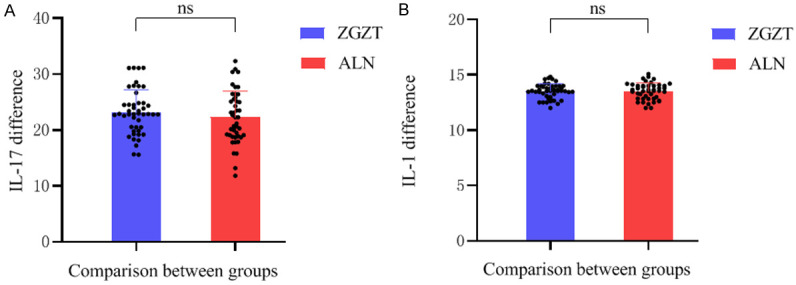
Figure 14.

Comparison of differences in IL-17 and IL-1 levels between the two groups before and after treatment. Note: (A) The image is the comparison of the IL-17 difference between the two groups, and (B) the image is the comparison of the IL-1 difference between the two groups.
