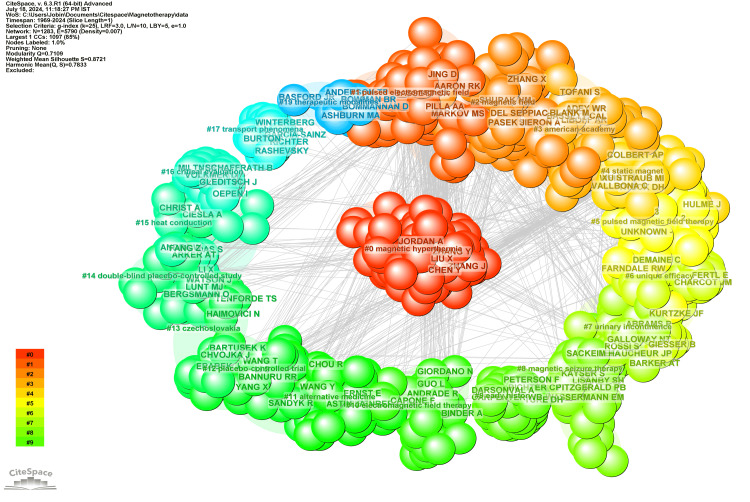
Figure 3. Network visualization of co-citation of cited authors.
The figure displays a network visualization of co-citation among cited authors, where the size of the nodes represents the frequency of citations, and the color gradient from red to green indicates the strength of co-citation relationships, with clusters highlighting closely related groups of authors within the research field.

