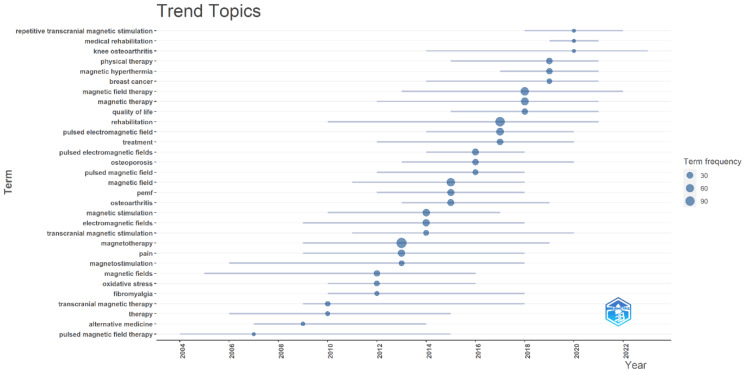
Figure 7. Visualization of trending topics.
The figure visualizes trending topics in the research field over time, where each line represents a term's presence across years, and the size of the dots indicates the frequency of that term in the literature, highlighting the rise and fall of various research interests with the most recent trends shown towards the right side of the graph.

