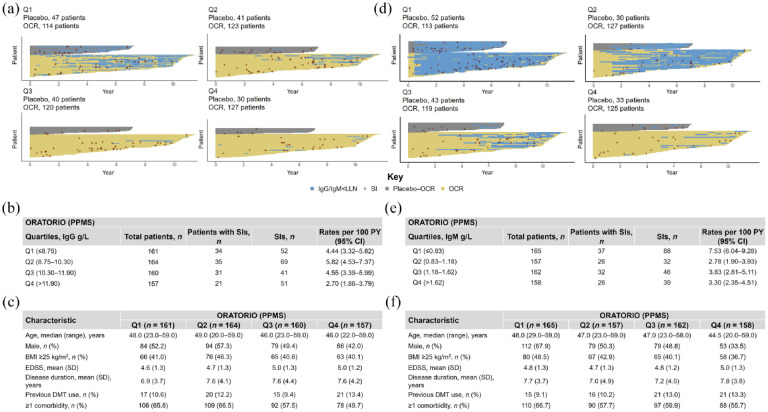
Figure 5.
Periods of IgG and IgM below LLN across baseline quartiles and association with SIs in ORATORIO (excluding COVID-19). Results for (a–c) IgG and (d–f) IgM quartiles. (a, d) Each horizontal yellow line represents OCR exposure of individual patients who were initially randomized to OCR. Each gray line represents OCR exposure of individual patients who were initially randomized to placebo and then switched to OCR. Blue horizontal lines represent the periods where Ig levels dropped below LLN (IgG LLN = 5.65 g/L; IgM LLN = 0.4 g/L). Each red cross represents an SI. Number of patients with SIs and cumulative rates of SIs per (b) baseline IgG quartiles and (e) IgM quartiles. Baseline demographics and disease characteristics of patients by (c) baseline IgG quartiles and (f) baseline IgM quartiles. CCOD, November 2022.
BMI, body mass index; CCOD, clinical cut-off date; CI, confidence interval; DMT, disease-modifying therapy; EDSS, Expanded Disability Status Scale; Ig, immunoglobulin; LLN, lower limit of normal; OCR, ocrelizumab; PPMS, primary progressive multiple sclerosis; PY, patient years; Q, quartile; SD, standard deviation; SI, serious infection.

