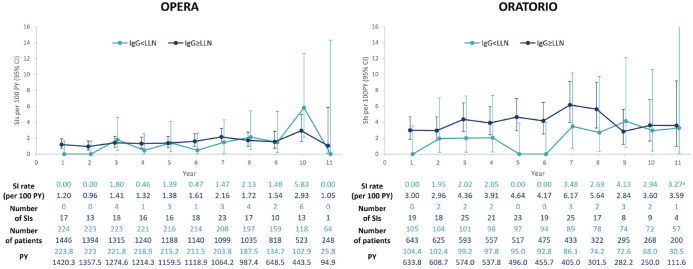
Figure 6.
Yearly rates of SIs in patients during periods of IgG < LLN and IgG ⩾ LLN, excluding COVID-19 infections, in patients with RMS (OPERA, n = 1488) and PPMS (ORATORIO, n = 644).
SIs were considered associated with IgG < LLN if the onset of the SI occurred while IgG < LLN. If the onset occurred while IgG levels were in the normal range, even if the SI resolution occurred while IgG < LLN, the infection was not considered to be associated with IgG < LLN. In any given year, a single patient could experience SIs while IgG was normal or below normal; therefore, the same patient can contribute to both curves (this explains why, for example, in Year 1, the sum of patients in both curves is 1670, whereas the number of patients at risk in the same period is 1488). Year 12 data are not represented in the graph as no SIs were reported. CCOD, November 2022.
a95% CI at Year 11 for patients with IgG < LLN from ORATORIO: 0.08–18.24.
CCOD, clinical cut-off date; CI, confidence interval; COVID-19, coronavirus disease 2019; Ig, immunoglobulin; LLN, lower limit of normal; OCR, ocrelizumab; PPMS, primary progressive multiple sclerosis; PY, patient years; RMS, relapsing multiple sclerosis; SI, serious infection.

