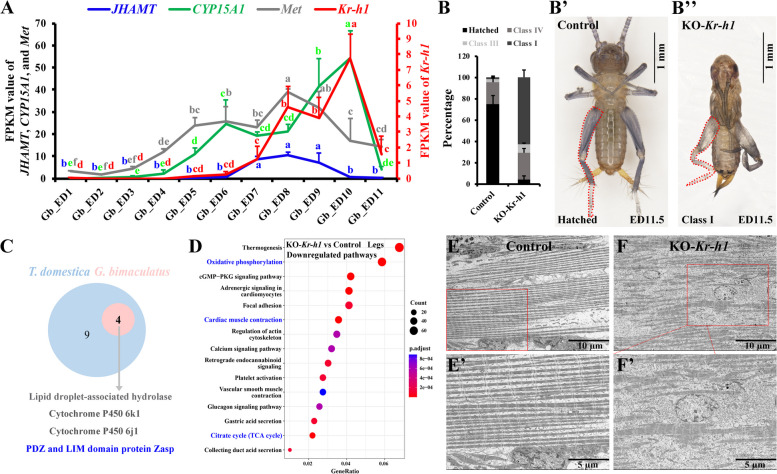
Fig. 4.
JH signaling is essential for leg maturation in embryos of G. bimaculatus. A Expression of JHAMT, CYP15A1, Met, and Kr-h1 in embryos of G. bimaculatus. The FPKM values in whole eggs at different ages from ED0 to ED11 are presented. RNA-seq data are represented as the mean ± s.e.m. for three biological replicates. B–B’’ Embryo phenotypes resulting from CRISPR/Cas9-mediated knockout of Kr-h1 (G0 mutants) in G. bimaculatus. Statistical analysis of the embryos of control and KO-Kr-h1 on ED13 (G0, n = 3 batches) is shown in B, following the classification criteria in T. domestica. Phenotype observation of the control (B, hatched) and KO-Kr-h1 (B’, class I) embryo at ED11.5. The legs were highlighted by red dashed lines. C Four genes, which are included in the gene set (screened through Venn analysis in T. domestica, containing 13 genes, refer to Fig. 3I), were also significantly downregulated in the embryonic legs of Kr-h1 G0 mutants in G. bimaculatus compared with those in control (transcriptome data). PDZ and LIM domain protein Zasp is highlighted in blue. D KEGG bubble map (top 15 downregulated pathways) derived from comparative transcriptomes (KO-Kr-h1 vs. control) of embryonic legs in G. bimaculatus. Embryonic legs were collected at ED10 and ED11 (mixed in a ratio of 6:4) from control and G0 mutants for RNA-seq. Genes with an adjusted P value < 0.05 (with no threshold for fold change) are considered differentially expressed. Each group contained three independent biological replicates, and at least 200 embryos classified as class I were pooled to generate one biological replicate. Oxidative phosphorylation, TCA cycle, and muscle contraction pathways are highlighted in blue on the diagram. E, F TEM observation of leg muscles in control and KO-Kr-h1 embryos at ED11. Detailed magnifications of muscle fibers in E and F (red boxes) are shown in E’ and F’, respectively

