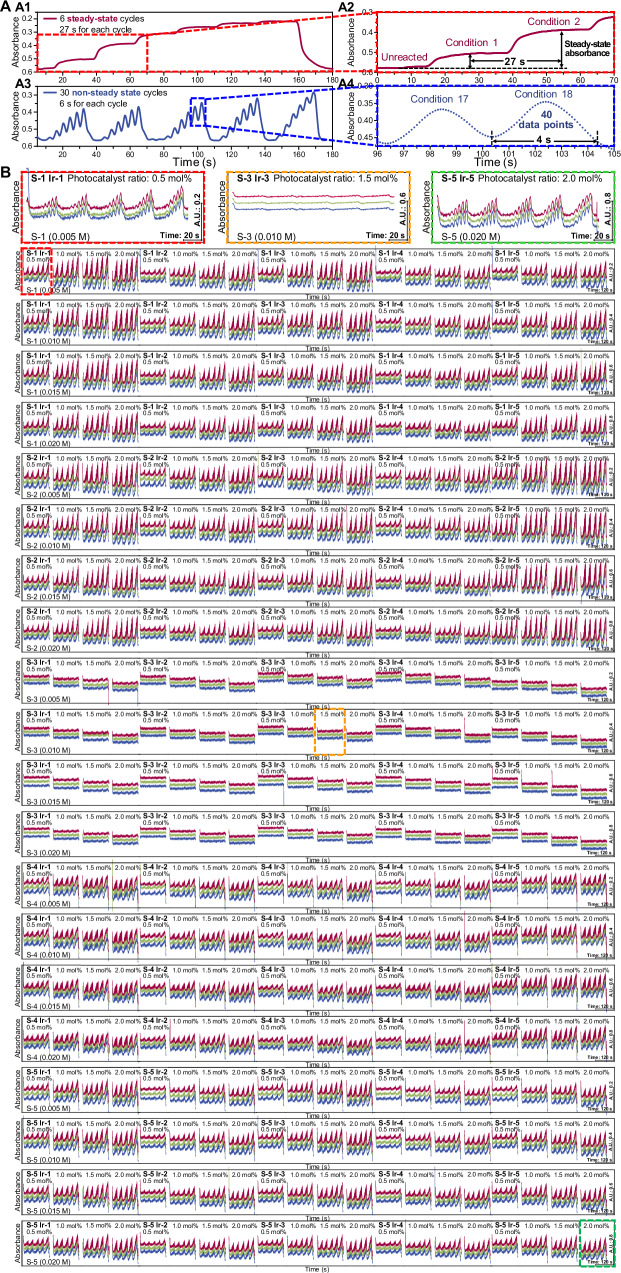
Fig. 3. Recordings of the typical and total absorbance signals obtained in the large-scale screening experiment.
A Typical recordings of the steady-state and non-steady-state absorbance signals obtained in the screening for S-5, with a photocatalyst ratio of 2 mol% and a S-5 concentration of 0.01 M. (A1) Typical absorbance recordings of 6 different reaction conditions under the steady-state screening mode. (A2) Enlarged view of the absorbance recordings for the first two conditions of the 6 reaction conditions in (A1). It took an average time of 27 s in each condition cycle to obtain the steady-state absorbance signal, which was calculated from the difference between the reacted steady-state plateau absorbance and the unreacted blank absorbance. (A3) Typical absorbance recordings of 30 different reaction conditions under the non-steady-state screening mode. (A4) Enlarged view of the absorbance recordings for the 17th and 18th conditions of the 30 reaction conditions in (A3). Each condition cycle took an average time of ca. 4 s, with a non-steady-state signal peak containing 40 absorbance data points, obtained using the laser pulse irradiation method. B Recordings of the non-steady-state peak signals obtained in the screening experiment of the total 12,000 reaction conditions, which was replicated three times to test the repeatability.

