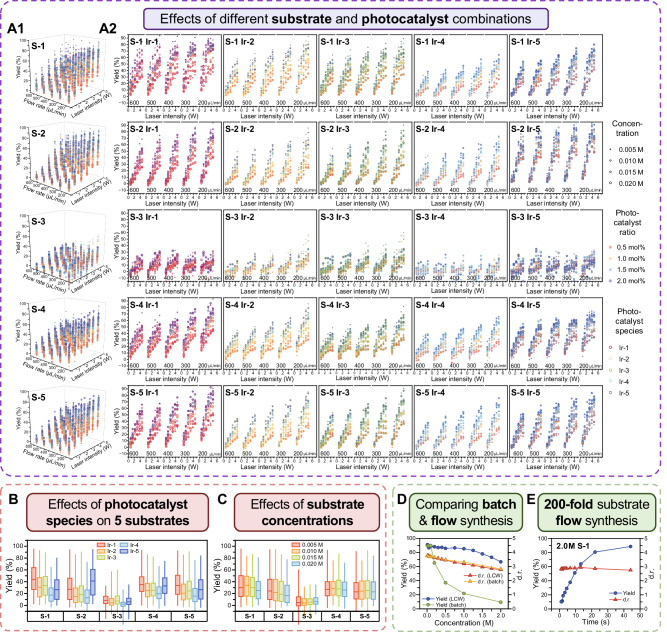
Fig. 5. Screening results of 12,000 reaction conditions.
A Multidimensional bubble plots of the 12,000 data, showing the effects of different variables on the product yield, including the species, concentrations, and ratios of the substrates and photocatalysts, laser light intensity, and flow rate of the reaction solutions. Each 6-dimensional bubble plot in (A1) contains 2400 product yield data of 1 substrate specie and 5 photocatalyst species. Each 5-dimensional bubble plots in (A2) contains 480 product yield data of 1 photocatalyst and 1 substrate specie, corresponding to a data square in the heatmap shown in Figure 4C2. In each 5-dimensional bubble plot, the colors of the contour lines of the bubbles represent different photocatalyst species, the colors filled in the bubbles represent different photocatalyst ratios, and the sizes of the bubbles represent different substrate concentrations. B Box plot showing the effect of the photocatalyst species on the product yields of the 5 substrates. The three horizontal lines of each box from top to bottom represent the first, median, and third quartiles of the product yield data, respectively. C Box plot showing the effect of the concentrations of the 5 substrates on the product yields. The three horizontal lines of each box from top to bottom represent the first, median, and third quartiles of the product yield data, respectively. D Comparisons of the variations of the product yield and d.r. with the increase of the S-1 concentration using the batch and present flow methods. E Variations of the product yield and d.r. with the increase of the residence time in the LCW microreactor using S-1 with a high concentration of 2.0 M, which is 200-fold of that in conventional batch systems.

