Figure 1.

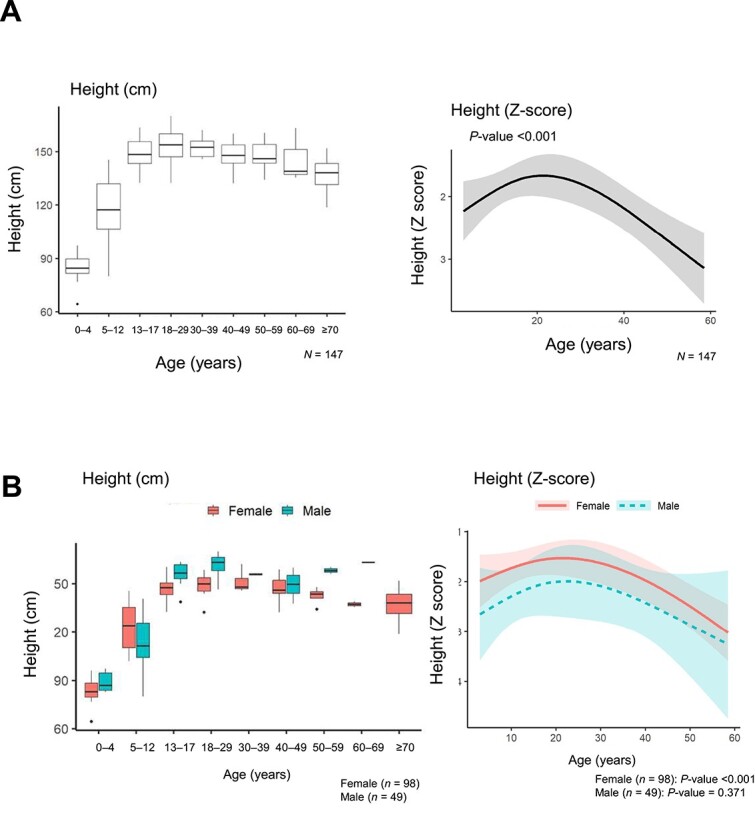
Height and height Z-score at enrollment versus age for all patients (A) and according to sex (B). Height is shown in the box-plot and height Z-scores are shown in regression models.

Height and height Z-score at enrollment versus age for all patients (A) and according to sex (B). Height is shown in the box-plot and height Z-scores are shown in regression models.