Figure 4.
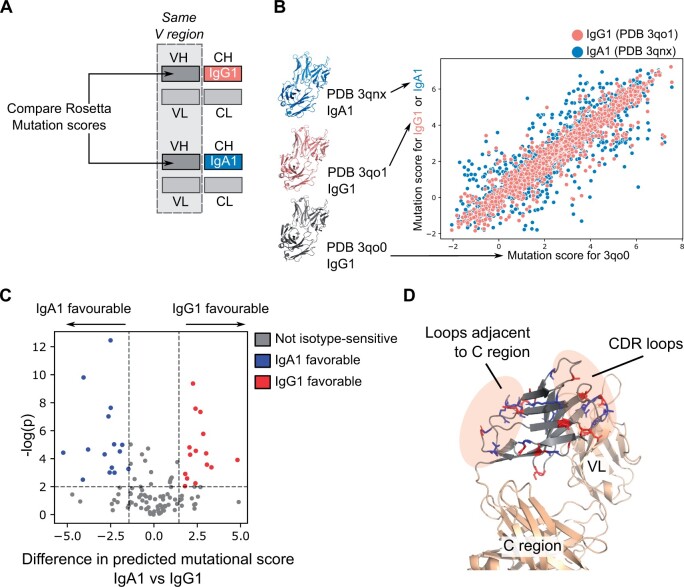
Exploring the consequence of isotype switching on antibody structural stability. (A) Rosetta mutational scanning scores for VH residues from antibodies of different isotypes are compared. These antibodies have the same VH and light chain sequences, the only difference between them is their CH1 domain. (B) Scatter plot of Rosetta mutational scanning scores. Dots correspond to the correlation between Rosetta mutational scores of structures of the same isotype (IgG1: PDB ID 3qo0 and PDB ID 3qo1) and structures of different isotypes (IgG1: PDB ID 3qo0 and IgA1: PDB ID 3qnx) are displayed. (C) A volcano plot is derived for each position in the VH domain by comparing the difference in the mutation scores calculated from the IgA1 versus the IgG1 structure (see Supplementary Materials S2.3). (D) The IgG1/IgA1-sensitive positions highlighted in panel (C) are visualized on the antibody structure. Most of them concentrate on CDR loops and loops close to C region.

