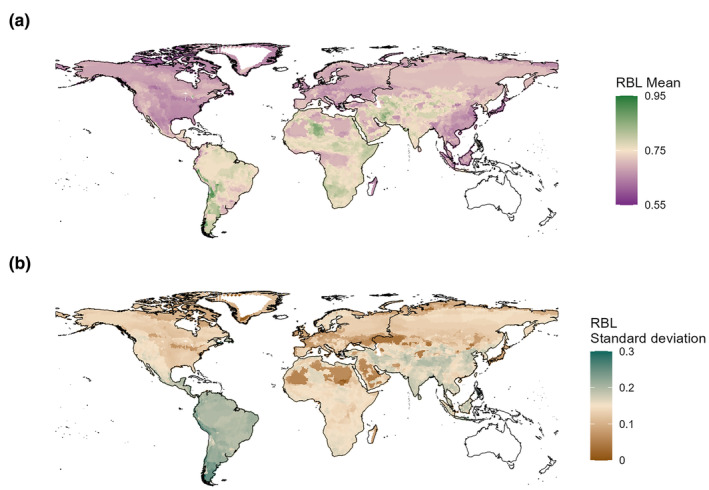
FIGURE 3.

Geography of carnivoran community RBL traits. Maps were created by sampling carnivoran communities composed of a minimum of three species traits at 50‐km point intervals. Areas in white indicate regions that have fewer than three carnivoran species per community. (a) Mean carnivoran community RBL. (b) Standard deviation in carnivoran community RBL.
