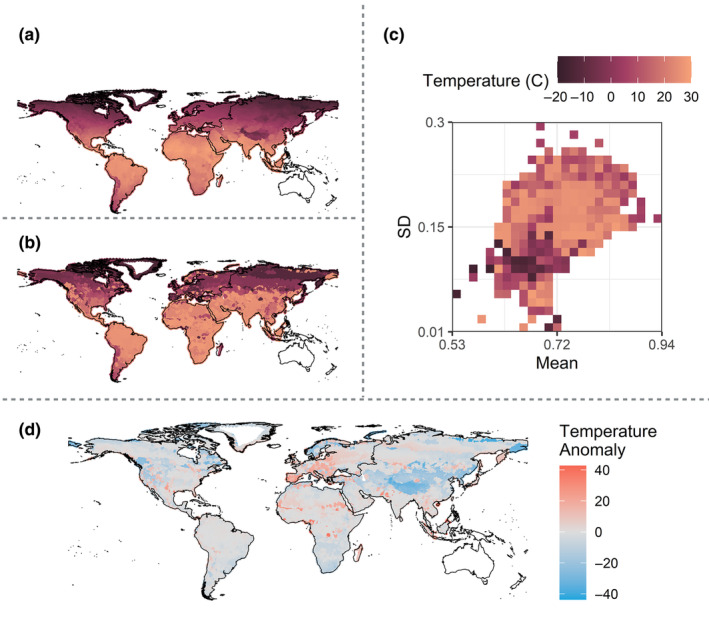
FIGURE 5.

Ecometric model associated with global mean annual temperature (MAT). (a) Observed MAT (Fick & Hijmans, 2017). (b) Ecometric space associated with carnivoran community RBL mean (x‐axis) and standard deviation (y‐axis), color‐coded based on the maximum likelihood estimate of MAT in each grid cell. Each grid cell in the ecometric space indicates communities associated with a specific RBL mean and standard deviation. (c) Estimated global MAT based on carnivoran RBL. (d) Anomaly map representing geographic regions in which community RBL was overestimated or underestimated. An overestimate (blue) corresponds to a model‐based estimate that is warmer than the observed temperature, while an underestimate (red) corresponds to a model‐based estimate that is colder than the observed temperature.
