
FIGURE 2.
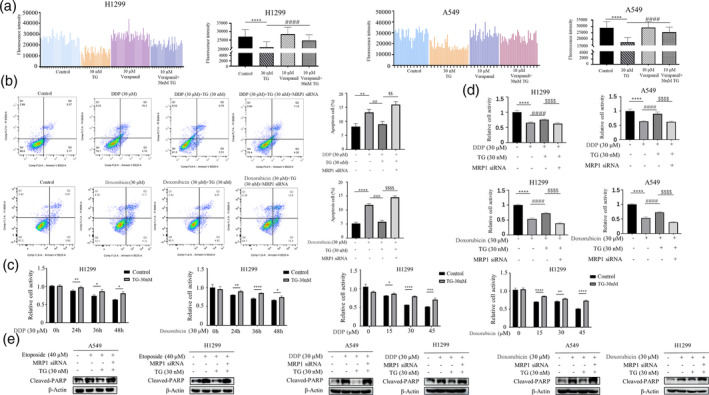
Reversal of MRP1 Enhances Cellular Sensitivity to Drugs. (a) After treating cells with TG (30 nM) for 12 h, cells were either left untreated or treated with the ABC transporter inhibitor Verapamil (10 μM). Representative histogram profiles of untreated cells (control), cells treated with 30 nM TG, 10 μM Verapamil, and the combined treatment of TG and Verapamil. The quantitative results are presented in the right panel, with data represented as the mean ± S.D. of triplicate measurements. Statistical analysis was performed using ANOVA with Dunnett's correction for multiple comparisons, indicating ****p < 0.0001 for the difference from control cells and #### p < 0.0001 for the difference from TG‐treated cells. (b) H1299 and A549 cells were first transfected with MRP1 siRNA, At 48 h post‐transfection, cells were treated with Diaminodichloroplatinum (DDP, 30 μM) or Doxorubicin (30 μM) in the presence or absence of TG (30 nM). Flow cytometry analysis revealed MRP1 siRNA rescued increased cell apoptosis in TG‐treated cells depletion of MRP1 by siRNA rescued increased cell apoptosis in TG‐treated cells (**p < 0.01 for difference from control cells, ## p < 0.01 for the difference from DDP or Doxorubicin‐treated cells, $$ p < 0.01 for difference from DDP or Doxorubicin and TG‐treated cells by ANOVA with Dunnett's correction for multiple comparisons). (c) The A549 and H1299 cells were treated with DDP or Doxorubicin for different time point (Left panel) and various concentrations (Right panel) in the presence or absence of TG (30 nM). MTT assay was used to detect cell viability (*p < 0.05, **p < 0.01, ***p < 0.001 for difference from control cells). (d) After transfecting with MRP1 siRNA for 48 h, cells were treated with DDP (30 μM) or Doxorubicin (30 μM) for 36 h in the presence or absence of TG (30 nM). MTT assay was used to detect cell viability. (****p < 0.001 for difference from control cells, #### p < 0.0001 for the difference from DDP or Doxorubicin‐treated cells, $$$$ p < 0.001 for difference from DDP or Doxorubicin and TG‐treated cells by ANOVA with Dunnett's correction for multiple comparisons). (e) The A549 and H1299 cells were first transfected with MRP1 siRNA. At 48 h post‐transfection, cells were treated with etoposide, DDP, and Doxorubicin in the presence and absence of TG followed by Western blot analysis of Cleaved‐PARP.