
FIGURE 2.
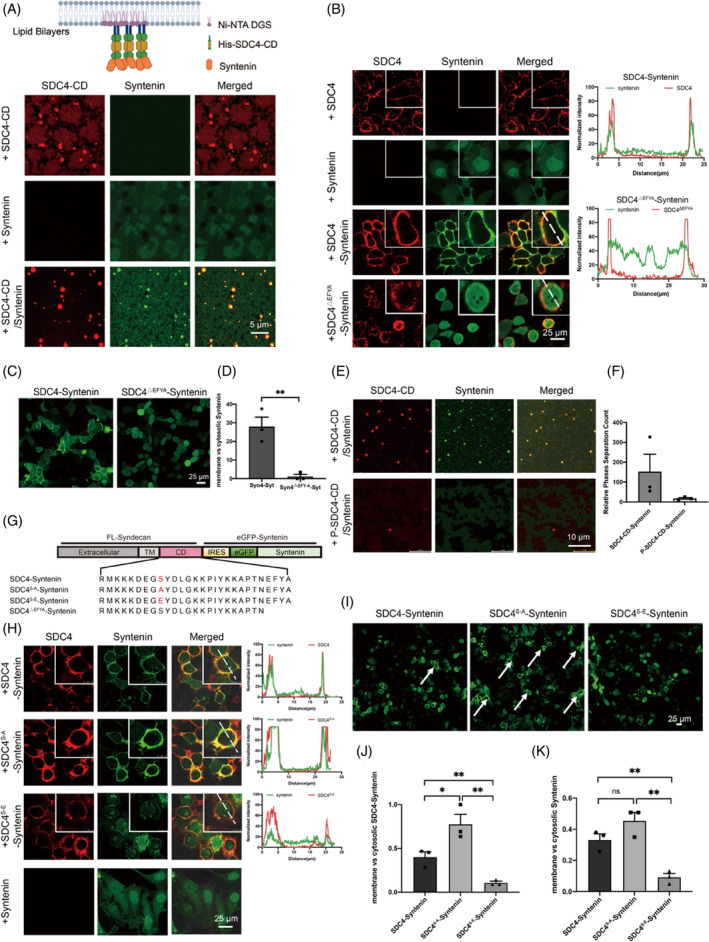
Phosphorylation of SDC4‐CD decreased syntenin recruitment to the PM. (A) Confocal microscopy images of the assembly of Cy3‐labelled SDC4‐CD with iFluor 488‐labelled syntenin on supported lipid bilayers (SLBs). Scale bar = 5 μm. (B) Confocal microscopy images of SDC4, SDC4S‐A, SDC4S‐E and SDC4△EFYA with eGFP‐tagged syntenin during cophase separation on the PM; eGFP‐tagged syntenin was expressed as the control. An anti‐SDC4‐ecto antibody and a Cy3‐labelled secondary antibody was used to detect the location of SDC4. Fluorescence colocalization was analysed by ImageJ software. (C) Without an antibody recognizing SDC4, confocal microscopy images showing eGFP‐tagged syntenin recruitment to the PM of SDC4 and syntenin, SDC4△EFYA and syntenin‐coexpressing HeLa cells. Scale bar = 25 μm. (D) The number of cells recruited syntenin to the cell membrane were counted. (E) Fluorescence images showing that 100 μM Cy3‐labelled P‐SDC4‐CD with 25 μM iFluor 488‐labelled syntenin triggered profoundly fewer droplets than were formed with treatment by the same molar concentration of Cy3‐labelled Syn‐CD and iFluor 488‐labelled syntenin on SLBs. Scale bar = 10 μm. (F) Histogram showing the number of SDC4‐CD‐syntenin droplets. (G) Schematic diagram and amino acid sequences of the SDC4 and syntenin coexpression plasmid containing unphosphorylated SDC4 and a mimic of phosphorylated SDC4 with eGFP‐tagged syntenin (SDC4S‐A‐syntenin and SDC4S‐E‐syntenin). Functional domains are shown in boxes. (H) Immunofluorescence (IF) assay showing that SDC4S‐E exhibited a weaker interaction with syntenin and that SDC4S‐A recruited a significant amount of syntenin to the plasma membrane (PM). Fluorescence colocalization was analysed with ImageJ software. An anti‐SDC4‐ecto antibody and a Cy3‐labelled secondary antibody were used to detect the location of SDC4. (I) Without an antibody recognizing SDC4, confocal microscopy images of eGFP‐tagged syntenin recruitment to the PM in SDC4 and syntenin, SDC4S‐A and syntenin, SDC4S‐E and syntenin‐coexpressing HeLa cells. Scale bar = 25 μm. (J) The number of cells that recruited SDC4 and syntenin to the cell membrane, as shown in Figure 2H, were counted. (*p < 0.05, **p < 0.01). (K) The number of cells that recruited eGFP‐tagged syntenin to the cell membrane is shown in Figure 2I (**p < 0.01).