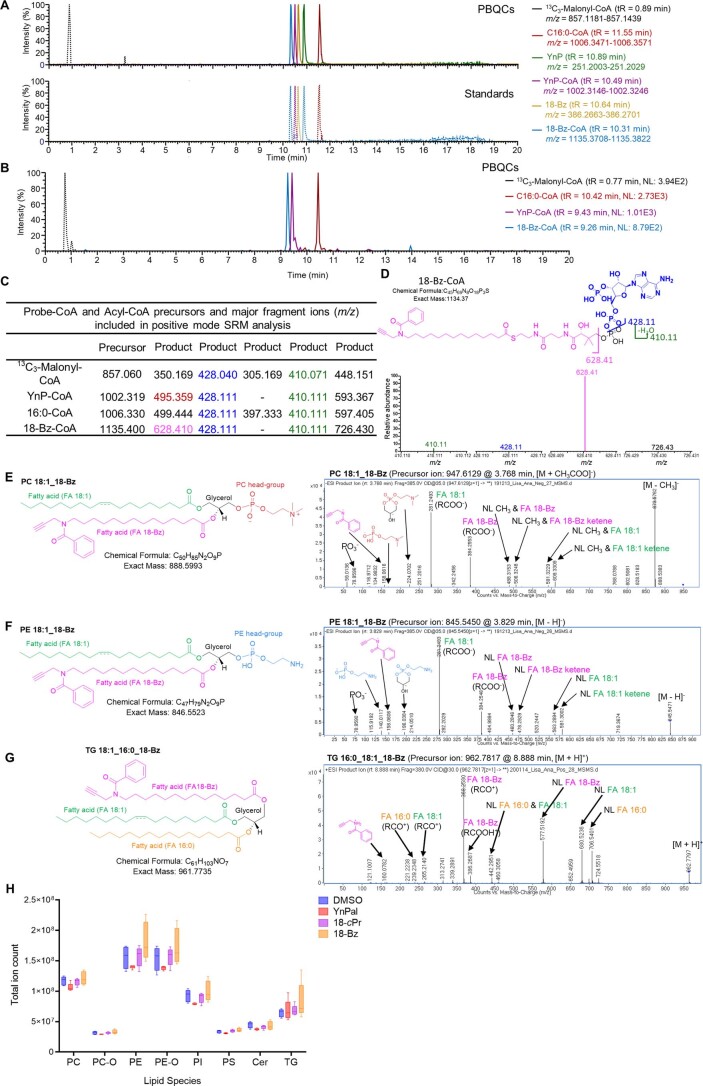
Extended Data Fig. 4. Metabolomic analysis of HEK293T cells.
HEK293T cells were treated with 30 µM YnPal or 18-Bz for 2 h in media containing 0.5% FBS. Cells were lysed, and metabolites extracted (see Supplementary Methods, Metabolomics). Polar metabolites (including probe and probe-CoA molecules) were analyzed by LC-MS. (a) Probes and probe-CoA molecules were detected by LC-HRMS in positive and negative modes. Features from sample pooled biological controls (PBQCs, solid lines, upper panel) and authentic standards (dotted lines, lower panel) had identical retention times (shown). 13C3-Malonyl-CoA (black dotted line) was used as an internal standard. Retention times (tR) and mass ranges (m/z) used for each molecule are shown. (b-e) Probe-CoA identifications were confirmed by LC-MS/MS in positive mode. (b) Panel shows an LC-MS/MS chromatogram of sample PBQCs, using selected ion monitoring (SRM) specific for probe-CoAs. Retention times (tR) and normalized intensities (NL) for each molecule are shown. (c) SRM transitions (precursor and most abundant product [M + H]+ ions) used for identification of probe-CoAs. (d) Upper panel show chemical structures, formulae, and exact masses of 18-Bz-CoA. Lower panel show spectra of major LC-MS/MS product ions for 18-Bz-CoA, with colors equivalent to fragmentations depicted in the upper panel. Product ion of m/z 726.43 (18-Bz-CoA) is equivalent to the ion m/z 628.41, but where an acyl chain moiety is retained. Abundance is shown relative to the most abundant product ion (m/z 628.41 for 18-Bz-CoA. (e-i) Lipidomic analysis of cells treated with 18-bump series. HEK293T cells were treated with DMSO and 15 µM YnPal, 18-cPr and 18-Bz for 4 h. After treatment, cells were lysed, extracted with tert-butyl methyl ether/methanol/water and sample lipids analyzed by UHPLC-MS/MS in the positive and negative mode. (e-g) Chemical structures and MS/MS spectra of selected PC, PE and TG lipid species incorporating an 18-Bz lipid side-chain. PC and PE spectra were acquired in negative polarity and TG spectrum was acquired in positive polarity. Note that TG species with an 18-Bz side chain preferentially formed the [M + H]+ ion, in contrast to endogenous TG species where the predominant ion forms are [M + NH3]+ and [M+Na]+, presumably due to facile protonation at the 18-Bz amide moiety. (h) Summed ion intensity of all endogenous lipid species identified within each major lipid class plotted using Prism 9.0. Box and whisker plots represent median values (center lines) and 25th and 75th percentiles (box limits) with Tukey whiskers, n = 5 independent experiments. FA, fatty acid; NL, neutral loss; PC, phosphatidylcholine; PE, phosphatidylethanolamine; TG, triacylglycerol; PI, phosphatidylinositol; PS, phosphatidylserine; Cer, ceramide. PC-O, ether-linked PC; PE-O, ether-linked PE.

