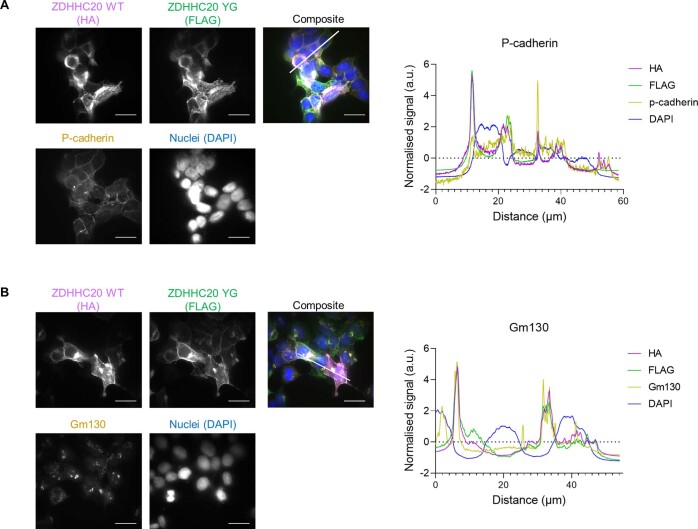
Extended Data Fig. 5. Localization of ZDHHC20 WT and Y181G mutant in HEK293T cells by overexpression.
(a) Left: representative confocal microscopy images showing average signal of Z-stacks of HEK293T cells transiently co-expressing ZDHHC20 WT HA-tagged and Y181G mutant FLAG-tagged. Each image shows signal for HA (magenta), FLAG (green), p-cadherin as plasma membrane marker (yellow), nucleus (blue) and a composite image of all signals. Scale bar at the bottom right marks 20 mm, while the other white line highlights the region of interest (ROI) used for image analysis. Right: plot showing normalized fluorescence signal for each of the channels in the ROI (1 biological replicate). (b) As a, but with using Gm130 as Golgi marker (1 biological replicate).

