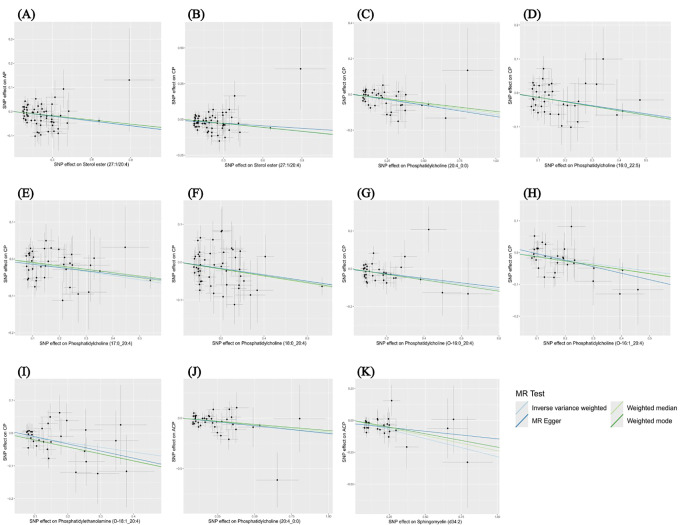
Figure 5.
Scatter plots depicting the causal relationship between the effect sizes of SNPs on plasma lipidome components (x-axis) and the corresponding effect sizes for pancreatitis (y-axis). Each plot focuses on a specific lipid species: (A) Sterol ester (27:1/20:4) on AP. (B) Sterol ester (27:1/20:4) on CP. (C) Phosphatidylcholine (20:4_0:0) on CP. (D) Phosphatidylcholine (16:0_22:5) on CP. (E) Phosphatidylcholine (17:0_20:4) on CP. (F) Phosphatidylcholine (18:0_20:4) on CP. (G) Phosphatidylcholine (O-16:0_20:4) on CP. (H) Phosphatidylcholine (O-16:1_20:4) on CP. (I) Phosphatidylethanolamine (O-18:1_20:4) on CP. (J) Phosphatidylcholine (20:4_0:0) on ACP. (K) Sphingomyelin (d34:2) on ACP.

