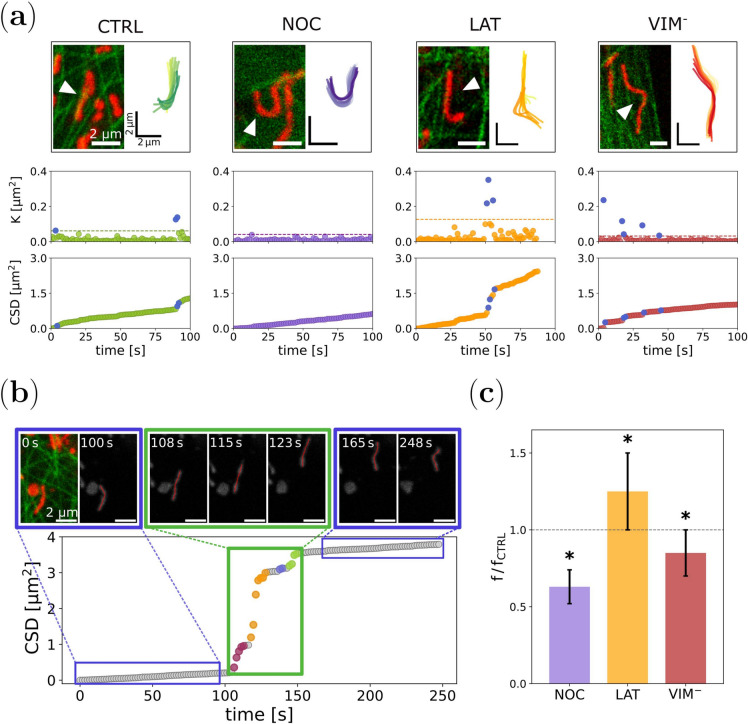
Fig. 3.
Quantification of intracellular forces involved in mitochondrial dynamics. (a) Temporal evolution of the square displacements K and the CSD for mitochondria within X. laevis melanophore cells. For each experimental condition, mitochondria were tracked (top panels, Supplementary Videos S5-S8) to compute K values and the CSD dependence over time (bottom panels). The K outliers and the corresponding jumps at the CSD plots are shown in blue. (b) Correlation of the CSD jumps and the active forces exerted on mitochondria. Representative time-lapse images and tracking of a mitochondrion engaging in active transport (top panel, Supplementary Video S4). When the organelle undergoes a significant longitudinal displacement, a jump is recorded in the CSD graph (bottom panel). The color code at the jump indicates the number of different events detected by the algorithm. (c) Mean frequency of events obtained from the CSD analysis for each experimental condition relative to CTRL, calculated as explained in the text. Asterisks denote significant differences with CTRL.

