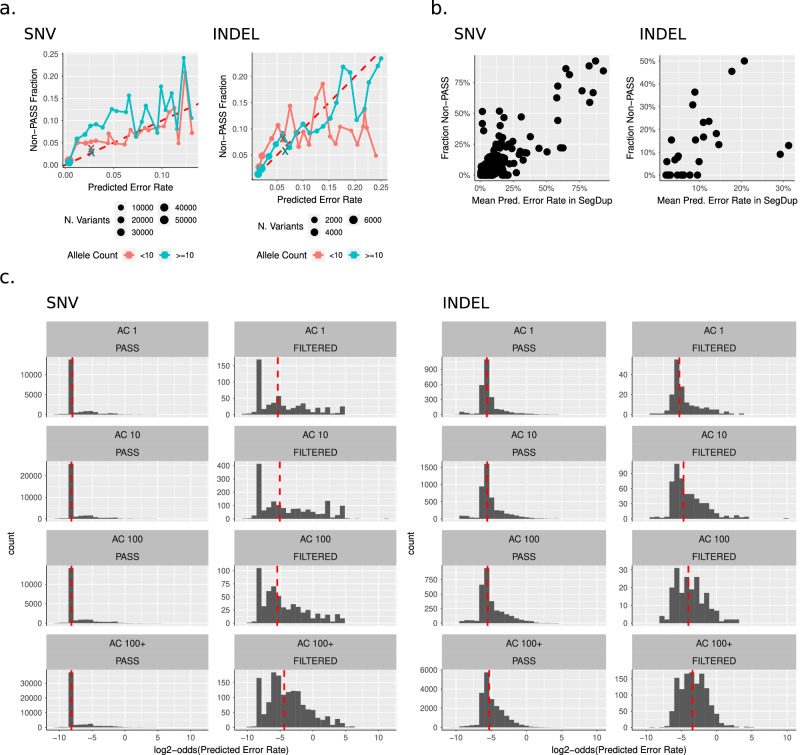
Fig. 5. Validation of ClinVar model predictions using gnomAD.
a Agreement plots between model predicted error rate and fraction of gnomAD non-PASS variants using 20 bins and stratified by gnomAD allele count. Each dot is a binned model probability, where the x position is the mean probability and the y position is the fraction of non-PASS in that bin. The “x” points are all variants that had no features in the model (and thus their probabilities are nearly identical) and the remaining points are variants with at least one feature. Red dotted line is y = x (perfect agreement). Data shown does not include the bottom 5% of probabilities, as these were sparse enough to appear as noise. b Correlations plots between mean model probability and a fraction of non-PASS variants in segmental duplications (SegDups). Each point represents one SegDup region and only regions with >10 variants are included. c Probability histograms for gnomAD PASS and non-PASS variants stratified by allele count (shown as an order of magnitude, so “AC 10” means “allele counts between 10 and 99”). Dotted red line is the median model probability for each histogram.

