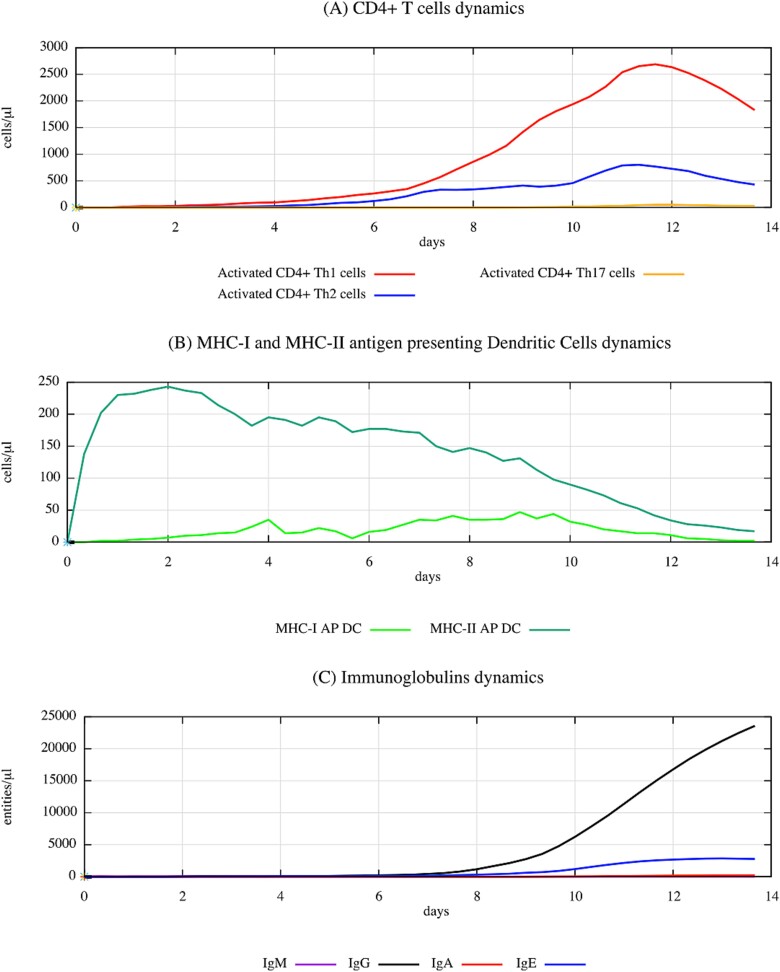
Figure 8.
Simulated immune dynamics in response to keratin-DNCB complex over a 14-day period, highlighting the cellular and humoral activities characteristic of ACD sensitization, as modelled by UISS-TOX. This figure captures the progression of DCs, various CD4+ T-cell subsets (TH1, TH2, TH17), and immunoglobulin responses (IgM, IgG, IgA, IgE). The data show a significant activation of TH1 cells, consistent with the TH1-mediated immune reaction typical in ACD.

