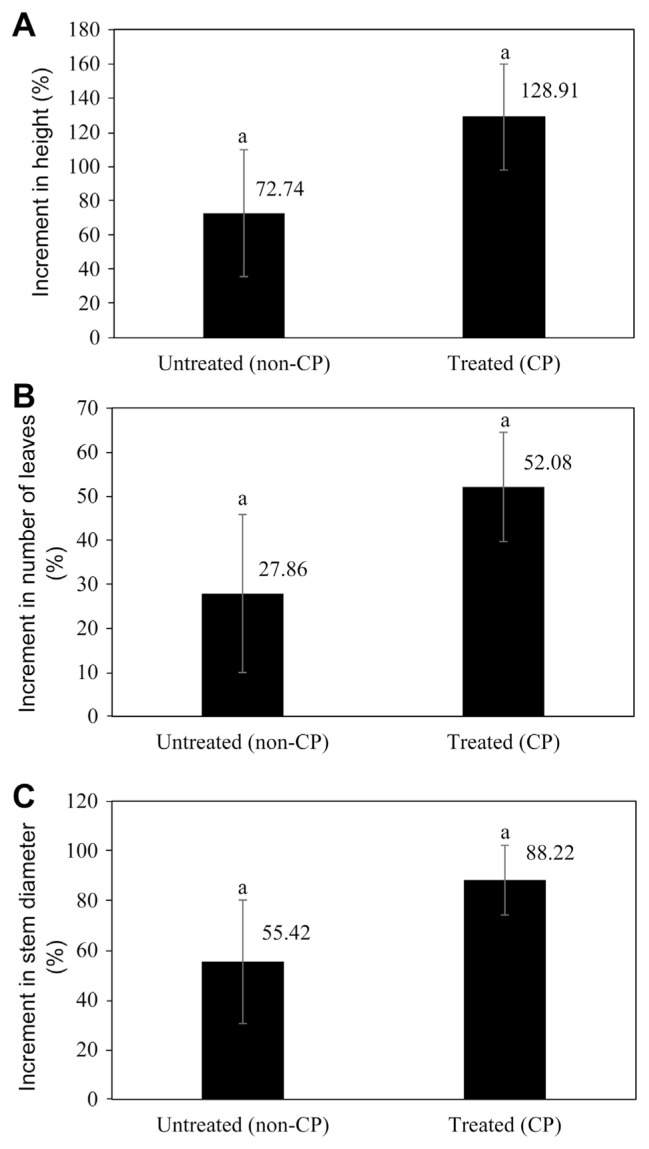
Fig. 1.
Effect of plasma treatment on the growth of Musa acuminata cv. ‘Berangan’. Percentage of increment in plant height (A), number of leaves (B), and stem diameter (C) observed for the duration of 3 months. Data represents the mean ± standard error (n = 4). Same alphabet on top of error bars of mean represents no significant differences as determined by T-test (P > 0.05).

